In this article, we are going to use Python to visualize the data in a Simple Line Chart. Nowadays, the internet is being bombarded with a huge amount of data each second. According to the Sixth edition of Domo Inc. reports, over 2.5 quintillion bytes of data are generated each second. We can use the data of our interest to get insights about it and Data Visualization provides a way to see the data graphically which provides an easier way to see the trends, patterns, outliers etc. As a human, we understand easily the abstract things rather than getting into the details. So, data visualization allows the draw insights from data in an effective manner.
A visually appealing representation of data conveys more meaning to the user rather than in tabular or textual form. It allows the user to see patterns and trends in the data that they never knew before.
You don’t need a heavy machine to visualize the complex data. You can quickly explore data using Python’s efficient libraries available. Python is highly used for data-intensive tasks. It can be genetics data, economic analysis, social media trend analysis, and much more.
Introducing matplotlib
matplotlib is one of the most popular mathematical plotting library available in Python. It is extensively used. We will use it to create different visualizations of data such as simple plots, line graphs, and scatter plots.
Pre-requisites
In order to follow this article series, we assume the following:
- You have some experience in Python.
- You have installed Python’s version 3.X
- You have pip installed
Installing matplotlib
In order to install matplotlib and it dependencies for macOS, Windows and Linux distributions, open the command prompt/shell and type the following command:
Make sure you have latest pip version. In order to update pip you can use the following command
> python –m pip install –-upgrade pip
> python –m pip install –U matplotlib
Testing matplotlib
In order to check whether matplotlib have successfully installed, open command prompt. Type following:
> python
>>> import matplotlib
If you don’t see any errors it means that matplotlib is successfully installed on your system. Now you can move to the next section of the article.
Types of Visualizations in matplotlib
There are numerous visualizations available in matplotlib. You can see the full list at here. Let us enlist some of them:
- Lines, bars and markers
- Stacked Bar Graph
- Horizontal Bar Chart
- Grouped Bar Chart
- and many more
- Subplots, axes and figures
- Aligning Labels
- Geographic Projections
- Multiple Subplots
- and many more
- Pie and Polar Charts
- Statistics related graphs and charts
Plotting a Simple Line Graph
A graph with points connected by lines is called a line graph. Let’s plot a simple line graph using matplotlib, and then modify it according to our needs to create a more informative visualization of our data.
We will use a function named generate_square_series(n) which will generate square number sequence as data for the graph.
Create a file named mpl_squares_plotting.py in your favorite editor.
def generate_square_series(n):
    squares = []

    # i starts from 1 and ends at n-1

    for i in range(1, n):
        squares.append(i * i)
    return squares
Now that we have written a function to generate data. Let’s use matplotlib to visualize it.
import matplotlib.pyplot as plt
# Using the function we’ve created
squares = generate_square_series(100)
plt.plot(squares)
plt.show()
Explanation of Code
We first imported the pyplot module as plt so we don’t have to type pyplot repeatedly.
pyplot contains functions that help to generate charts and plots.
Then we used the function generate_square_series that returns a list and we have assigned it to squares object reference.
We then passed the squares list to the function plot() which plots the number.
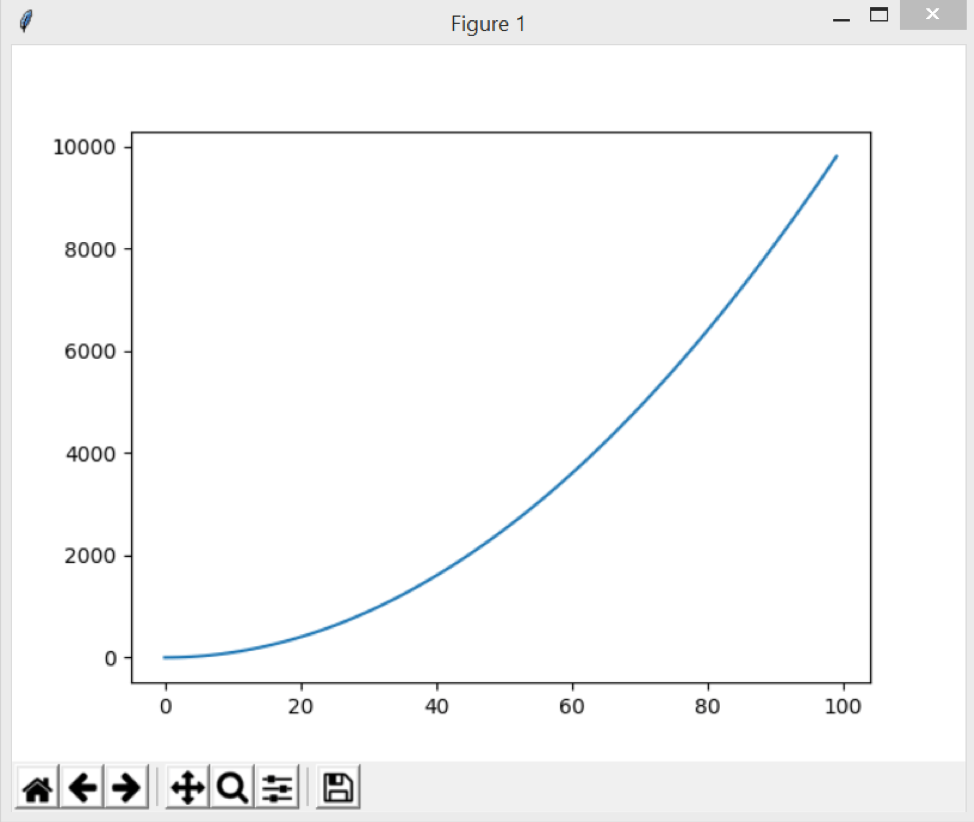
plt.show() opens matplotlib’s viewer and displays the plot as shown in the figure below.
Here’re more Articles, you might be interested: