matplotlib.axes.Axes.stackplot
-
Axes.stackplot(axes, x, *args, labels=(), colors=None, baseline='zero', data=None, **kwargs)
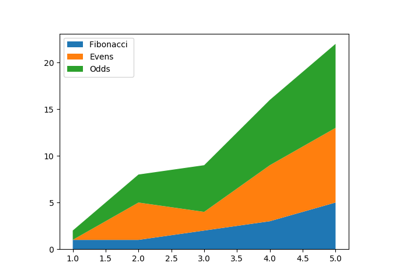
Draw a stacked area plot.
| Parameters: |
- x : 1d array of dimension N
- y : 2d array (dimension MxN), or sequence of 1d arrays (each dimension 1xN)
The data is assumed to be unstacked. Each of the following
calls is legal:
stackplot(x, y)               # where y is MxN
stackplot(x, y1, y2, y3, y4)  # where y1, y2, y3, y4, are all 1xNm
- baseline : {'zero', 'sym', 'wiggle', 'weighted_wiggle'}
Method used to calculate the baseline:
'zero': Constant zero baseline, i.e. a simple stacked plot.'sym': Symmetric around zero and is sometimes called
'ThemeRiver'.'wiggle': Minimizes the sum of the squared slopes.'weighted_wiggle': Does the same but weights to account for
size of each layer. It is also called 'Streamgraph'-layout. More
details can be found at http://leebyron.com/streamgraph/.
- labels : Length N sequence of strings
Labels to assign to each data series.
- colors : Length N sequence of colors
A list or tuple of colors. These will be cycled through and used to
colour the stacked areas.
- **kwargs
All other keyword arguments are passed to Axes.fill_between().
|
|---|
| Returns: |
- list : list of
PolyCollection
A list of PolyCollection instances, one for each element in the
stacked area plot.
|
|---|
Notes
Note
In addition to the above described arguments, this function can take a
data keyword argument. If such a data argument is given, the
following arguments are replaced by data[<arg>]:
- All positional and all keyword arguments.
Objects passed as data must support item access (data[<arg>]) and
membership test (<arg> in data).
Examples using matplotlib.axes.Axes.stackplot
© Copyright 2002 - 2012 John Hunter, Darren Dale, Eric Firing, Michael Droettboom and the Matplotlib development team; 2012 - 2018 The Matplotlib development team.
Last updated on Jan 05, 2020.
Created using
Sphinx 1.8.5.
Doc version v3.1.1-79-g90d53b526.