GV

GeezerVison

The World Wide Web, restored to 800 pixels of glory.

Home|About|Gaming cabinet|Archives|How it works|Starter sites

On this site

  • Plot types
  • User guide
  • Tutorials
  • Examples
  • Reference
  • Contribute
  • Releases
  • Gitter
  • Discourse
  • GitHub
  • matplotlib
  • matplotlib.animation
  • matplotlib.animation.Animation
  • matplotlib.animation.FuncAnimation

This view

  • Original page
  • New address

GeezerVison is showing matplotlib.org — matplotlib.pyplot.gca — Matplotlib 3.11.2 documentation

matplotlib.pyplot.gca#

matplotlib.pyplot.gca()[source]#

Get the current Axes.

If there is currently no Axes on this Figure, a new one is created using Figure.add_subplot. (To test whether there is currently an Axes on a Figure, check whether figure.axes is empty. To test whether there is currently a Figure on the pyplot figure stack, check whether pyplot.get_fignums() is empty.)

Notes

Note

This is the pyplot wrapper for Figure.gca.
Examples using matplotlib.pyplot.gca#

Multicolored lines

Multicolored lines

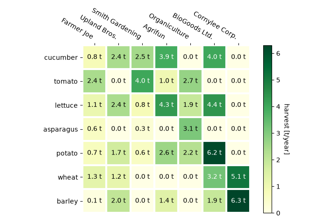
Annotated heatmap

Annotated heatmap

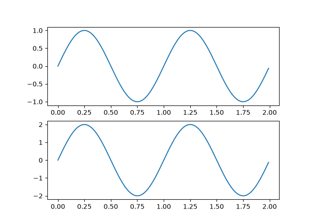
Manage multiple figures in pyplot

Manage multiple figures in pyplot

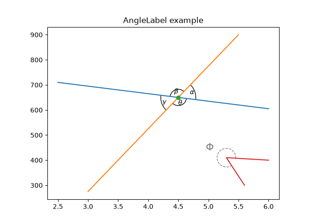
Scale invariant angle label

Scale invariant angle label

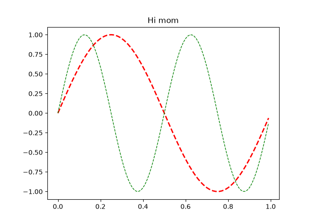
Set and get properties

Set and get properties

Hinton diagrams

Hinton diagrams

Tight layout guide

Tight layout guide
On this page
You are visitor 01402503 — GeezerVison does not store the pages you look up.
Best viewed with Netscape Navigator 4.7 or Internet Explorer 6 at 800×600. No cookies required.