GV

GeezerVison

The World Wide Web, restored to 800 pixels of glory.

Home|About|Gaming cabinet|Archives|How it works|Starter sites

On this site

  • Plot types
  • User guide
  • Tutorials
  • Examples
  • Reference
  • Contribute
  • Releases
  • Gitter
  • Discourse
  • GitHub
  • matplotlib
  • matplotlib.animation
  • matplotlib.animation.Animation
  • matplotlib.animation.FuncAnimation

This view

  • Original page
  • New address

GeezerVison is showing matplotlib.org — matplotlib.pyplot.xlabel — Matplotlib 3.11.2 documentation

matplotlib.pyplot.xlabel#

matplotlib.pyplot.xlabel(xlabel, fontdict=None, labelpad=None, *, loc=None, **kwargs)[source]#

Set the label for the x-axis.

Parameters:
xlabelstr

The label text.

labelpadfloat, default: rcParams["axes.labelpad"] (default: 4.0)

Spacing in points from the Axes bounding box including ticks and tick labels. If None, the previous value is left as is.

loc{'left', 'center', 'right'}, default: rcParams["xaxis.labellocation"] (default: 'center')

The label position. This is a high-level alternative for passing parameters x and horizontalalignment.

Other Parameters:
**kwargsText properties

Text properties control the appearance of the label.

See also

text

Documents the properties supported by Text.

Notes

Note

This is the pyplot wrapper for axes.Axes.set_xlabel.

Examples using matplotlib.pyplot.xlabel#
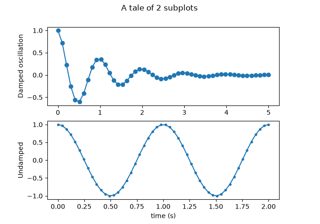
Multiple subplots

Multiple subplots

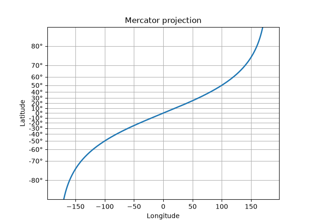
Custom scale

Custom scale

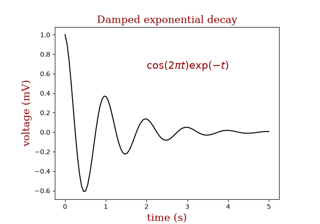
Controlling style of text and labels using a dictionary

Controlling style of text and labels using a dictionary
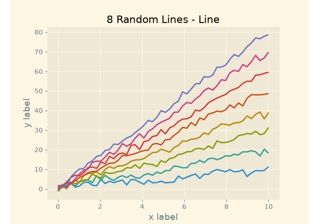
Solarized Light stylesheet

Solarized Light stylesheet

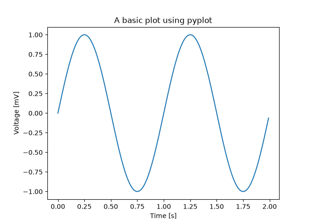
Basic plot

Basic plot

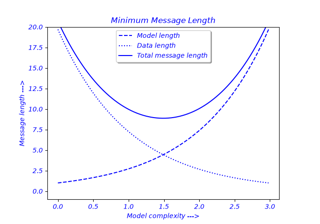
Findobj Demo

Findobj Demo

Pyplot tutorial

Pyplot tutorial

Quick start guide

Quick start guide
On this page
You are visitor 01402503 — GeezerVison does not store the pages you look up.
Best viewed with Netscape Navigator 4.7 or Internet Explorer 6 at 800×600. No cookies required.