Note
Go to the end to download the full example code.
Violin plot basics#
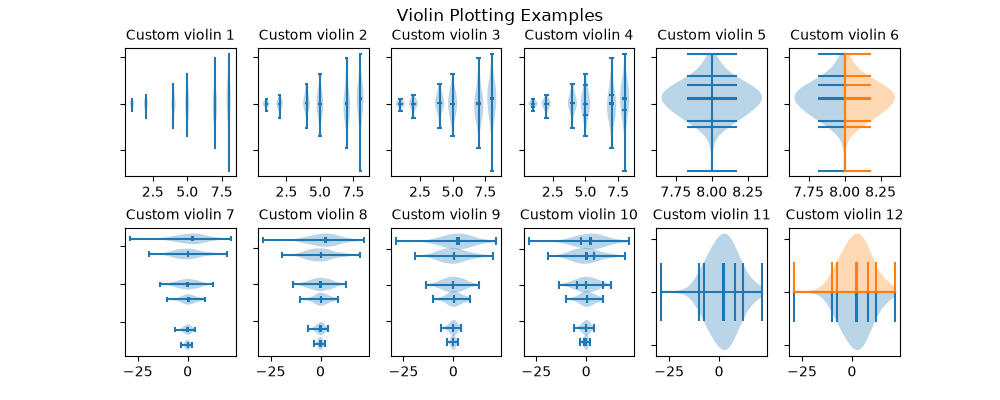
Violin plots are similar to histograms and box plots in that they show
an abstract representation of the probability distribution of the
sample. Rather than showing counts of data points that fall into bins
or order statistics, violin plots use kernel density estimation (KDE) to
compute an empirical distribution of the sample. That computation
is controlled by several parameters. This example demonstrates how to
modify the number of points at which the KDE is evaluated (points)
and how to modify the bandwidth of the KDE (bw_method).
For more information on violin plots and KDE, the scikit-learn docs have a great section: https://scikit-learn.org/stable/modules/density.html
import matplotlib.pyplot as plt
import numpy as np

# Fixing random state for reproducibility
np.random.seed(19680801)


# fake data
fs = 10  # fontsize
pos = [1, 2, 4, 5, 7, 8]
data = [np.random.normal(0, std, size=100) for std in pos]

fig, axs = plt.subplots(nrows=2, ncols=6, figsize=(10, 4))

axs[0, 0].violinplot(data, pos, points=20, widths=0.3,
                     showmeans=True, showextrema=True, showmedians=True)
axs[0, 0].set_title('Custom violin 1', fontsize=fs)

axs[0, 1].violinplot(data, pos, points=40, widths=0.5,
                     showmeans=True, showextrema=True, showmedians=True,
                     bw_method='silverman')
axs[0, 1].set_title('Custom violin 2', fontsize=fs)

axs[0, 2].violinplot(data, pos, points=60, widths=0.7, showmeans=True,
                     showextrema=True, showmedians=True, bw_method=0.5)
axs[0, 2].set_title('Custom violin 3', fontsize=fs)

axs[0, 3].violinplot(data, pos, points=60, widths=0.7, showmeans=True,
                     showextrema=True, showmedians=True, bw_method=0.5,
                     quantiles=[[0.1], [], [], [0.175, 0.954], [0.75], [0.25]])
axs[0, 3].set_title('Custom violin 4', fontsize=fs)

axs[0, 4].violinplot(data[-1:], pos[-1:], points=60, widths=0.7,
                     showmeans=True, showextrema=True, showmedians=True,
                     quantiles=[0.05, 0.1, 0.8, 0.9], bw_method=0.5)
axs[0, 4].set_title('Custom violin 5', fontsize=fs)

axs[0, 5].violinplot(data[-1:], pos[-1:], points=60, widths=0.7,
                     showmeans=True, showextrema=True, showmedians=True,
                     quantiles=[0.05, 0.1, 0.8, 0.9], bw_method=0.5, side='low')

axs[0, 5].violinplot(data[-1:], pos[-1:], points=60, widths=0.7,
                     showmeans=True, showextrema=True, showmedians=True,
                     quantiles=[0.05, 0.1, 0.8, 0.9], bw_method=0.5, side='high')
axs[0, 5].set_title('Custom violin 6', fontsize=fs)

axs[1, 0].violinplot(data, pos, points=80, orientation='horizontal', widths=0.7,
                     showmeans=True, showextrema=True, showmedians=True)
axs[1, 0].set_title('Custom violin 7', fontsize=fs)

axs[1, 1].violinplot(data, pos, points=100, orientation='horizontal', widths=0.9,
                     showmeans=True, showextrema=True, showmedians=True,
                     bw_method='silverman')
axs[1, 1].set_title('Custom violin 8', fontsize=fs)

axs[1, 2].violinplot(data, pos, points=200, orientation='horizontal', widths=1.1,
                     showmeans=True, showextrema=True, showmedians=True,
                     bw_method=0.5)
axs[1, 2].set_title('Custom violin 9', fontsize=fs)

axs[1, 3].violinplot(data, pos, points=200, orientation='horizontal', widths=1.1,
                     showmeans=True, showextrema=True, showmedians=True,
                     quantiles=[[0.1], [], [], [0.175, 0.954], [0.75], [0.25]],
                     bw_method=0.5)
axs[1, 3].set_title('Custom violin 10', fontsize=fs)

axs[1, 4].violinplot(data[-1:], pos[-1:], points=200, orientation='horizontal',
                     widths=1.1, showmeans=True, showextrema=True, showmedians=True,
                     quantiles=[0.05, 0.1, 0.8, 0.9], bw_method=0.5)
axs[1, 4].set_title('Custom violin 11', fontsize=fs)

axs[1, 5].violinplot(data[-1:], pos[-1:], points=200, orientation='horizontal',
                     widths=1.1, showmeans=True, showextrema=True, showmedians=True,
                     quantiles=[0.05, 0.1, 0.8, 0.9], bw_method=0.5, side='low')

axs[1, 5].violinplot(data[-1:], pos[-1:], points=200, orientation='horizontal',
                     widths=1.1, showmeans=True, showextrema=True, showmedians=True,
                     quantiles=[0.05, 0.1, 0.8, 0.9], bw_method=0.5, side='high')
axs[1, 5].set_title('Custom violin 12', fontsize=fs)


for ax in axs.flat:
    ax.set_yticklabels([])

fig.suptitle("Violin Plotting Examples")
fig.subplots_adjust(hspace=0.4)
plt.show()
Tags: plot-type: violin domain: statistics
References
The use of the following functions, methods, classes and modules is shown in this example:
Total running time of the script: (0 minutes 1.652 seconds)