GV

GeezerVison

The World Wide Web, restored to 800 pixels of glory.

Home|About|Gaming cabinet|Archives|How it works|Starter sites

On this site

  • Plot types
  • User guide
  • Tutorials
  • Examples
  • Reference
  • Contribute
  • Releases
  • Gitter
  • Discourse
  • GitHub
  • Lines, bars and markers
  • Line plot
  • Linestyles
  • Dashed line style configuration

This view

  • Original page
  • New address

GeezerVison is showing matplotlib.org — Axis label position — Matplotlib 3.11.2 documentation

Note

Go to the end to download the full example code.

Axis label position#

Choose axis label position when calling set_xlabel and set_ylabel as well as for colorbar.

import matplotlib.pyplot as plt

fig, ax = plt.subplots()

sc = ax.scatter([1, 2], [1, 2], c=[1, 2])
ax.set_ylabel('YLabel', loc='top')
ax.set_xlabel('XLabel', loc='left')
cbar = fig.colorbar(sc)
cbar.set_label("ZLabel", loc='top')

plt.show()
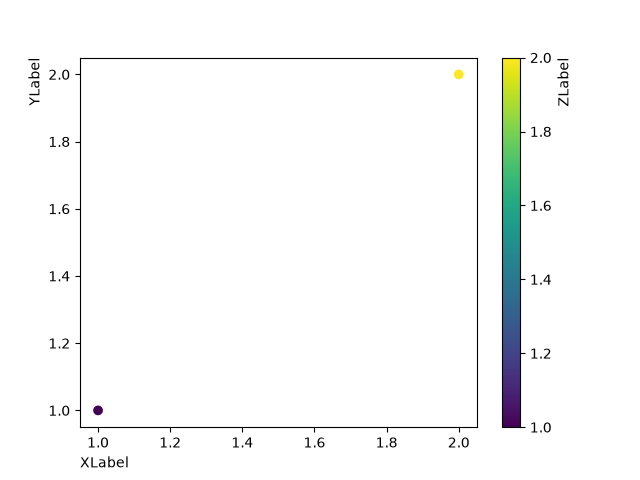
axis labels demo

Tags: component: axis styling: position level: beginner

Download Jupyter notebook: axis_labels_demo.ipynb

Download Python source code: axis_labels_demo.py

Download zipped: axis_labels_demo.zip

Gallery generated by Sphinx-Gallery

You are visitor 01402605 — GeezerVison does not store the pages you look up.
Best viewed with Netscape Navigator 4.7 or Internet Explorer 6 at 800×600. No cookies required.