GV

GeezerVison

The World Wide Web, restored to 800 pixels of glory.

Home|About|Gaming cabinet|Archives|How it works|Starter sites

On this site

  • Plot types
  • User guide
  • Tutorials
  • Examples
  • Reference
  • Contribute
  • Releases
  • Gitter
  • Discourse
  • GitHub
  • Lines, bars and markers
  • Line plot
  • Linestyles
  • Dashed line style configuration

This view

  • Original page
  • New address

GeezerVison is showing matplotlib.org — Multicursor — Matplotlib 3.11.2 documentation

Note

Go to the end to download the full example code.

Multicursor#

Showing a cursor on multiple plots simultaneously.

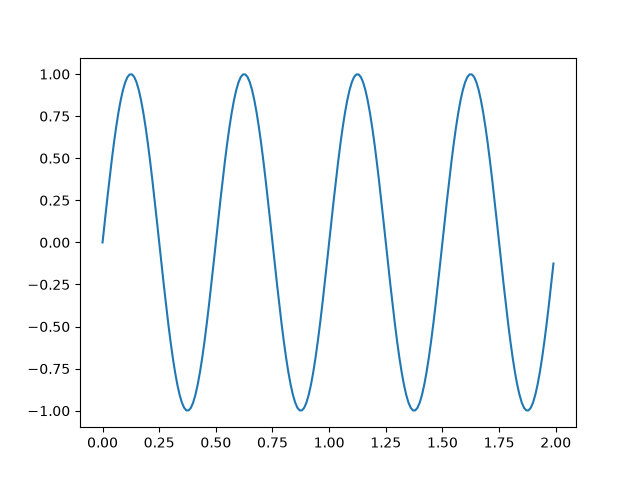
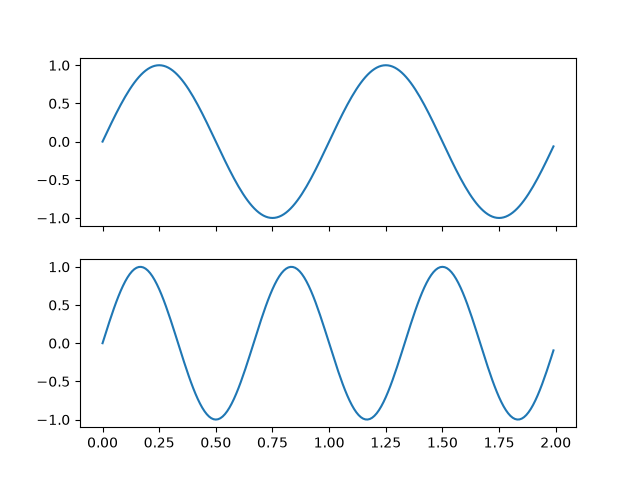
This example generates three Axes split over two different figures. On hovering the cursor over data in one subplot, the values of that datapoint are shown in all Axes.

import matplotlib.pyplot as plt
import numpy as np

from matplotlib.widgets import MultiCursor

t = np.arange(0.0, 2.0, 0.01)
s1 = np.sin(2*np.pi*t)
s2 = np.sin(3*np.pi*t)
s3 = np.sin(4*np.pi*t)

fig, (ax1, ax2) = plt.subplots(2, sharex=True)
ax1.plot(t, s1)
ax2.plot(t, s2)
fig, ax3 = plt.subplots()
ax3.plot(t, s3)

multi = MultiCursor((ax1, ax2, ax3), color='r', lw=1)
plt.show()
  • multicursor
  • multicursor

References

The use of the following functions, methods, classes and modules is shown in this example:

  • matplotlib.widgets.MultiCursor

Total running time of the script: (0 minutes 1.200 seconds)

Download Jupyter notebook: multicursor.ipynb

Download Python source code: multicursor.py

Download zipped: multicursor.zip

Gallery generated by Sphinx-Gallery

You are visitor 01402503 — GeezerVison does not store the pages you look up.
Best viewed with Netscape Navigator 4.7 or Internet Explorer 6 at 800×600. No cookies required.