Pairwise data#
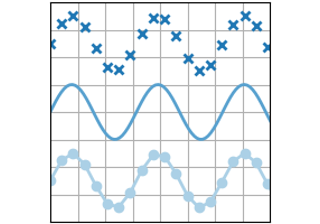
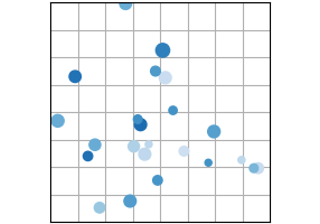
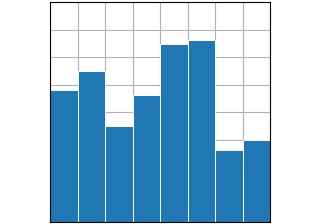
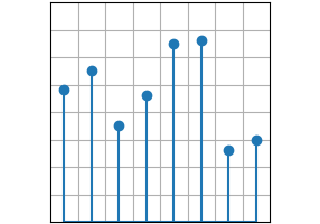
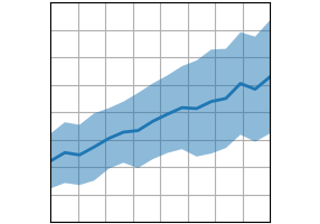
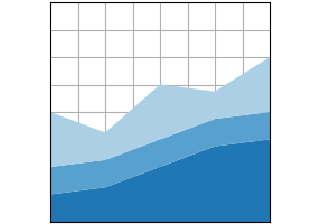
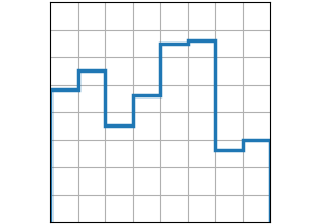
Plots of pairwise \((x, y)\), tabular \((var\_0, \cdots, var\_n)\), and functional \(f(x)=y\) data.
GeezerVisonThe World Wide Web, restored to 800 pixels of glory. |
| Home|About|Gaming cabinet|Archives|How it works|Starter sites |
GeezerVison is showing matplotlib.org — Pairwise data — Matplotlib 3.11.2 documentation Pairwise data#Plots of pairwise \((x, y)\), tabular \((var\_0, \cdots, var\_n)\), and functional \(f(x)=y\) data. |
| You are visitor 01402503 — GeezerVison does not store the pages you look up. Best viewed with Netscape Navigator 4.7 or Internet Explorer 6 at 800×600. No cookies required. |