GV

GeezerVison

The World Wide Web, restored to 800 pixels of glory.

Home|About|Gaming cabinet|Archives|How it works|Starter sites

On this site

  • cf-plot 3.6.0 documentation
  • Introduction
  • Installation
  • Plots by type/theme
  • Examples
  • User guide
  • Advanced use
  • API reference
  • Releases and changes
  • Support and contributing
  • Training material
  • License

This view

  • Original page
  • New address

GeezerVison is showing ncas-cms.github.io — cf-plot documentation — cf-plot 3.6.0 documentation

cf-plot documentation#

cf-plot: code-light plotting for earth science and aligned research

Overview#

cf-plot allows you to produce and customise publication-quality contour, vector, line and more plots with the power of Python, matplotlib, Cartopy and cf-python in as few lines of code as possible.

It is designed to be a useful visualisation tool for environmental, earth and aligned sciences, for example to facilitate climate and meteorological research. cf-plot is developed and maintained by the NCAS-CMS group, part of NCAS.
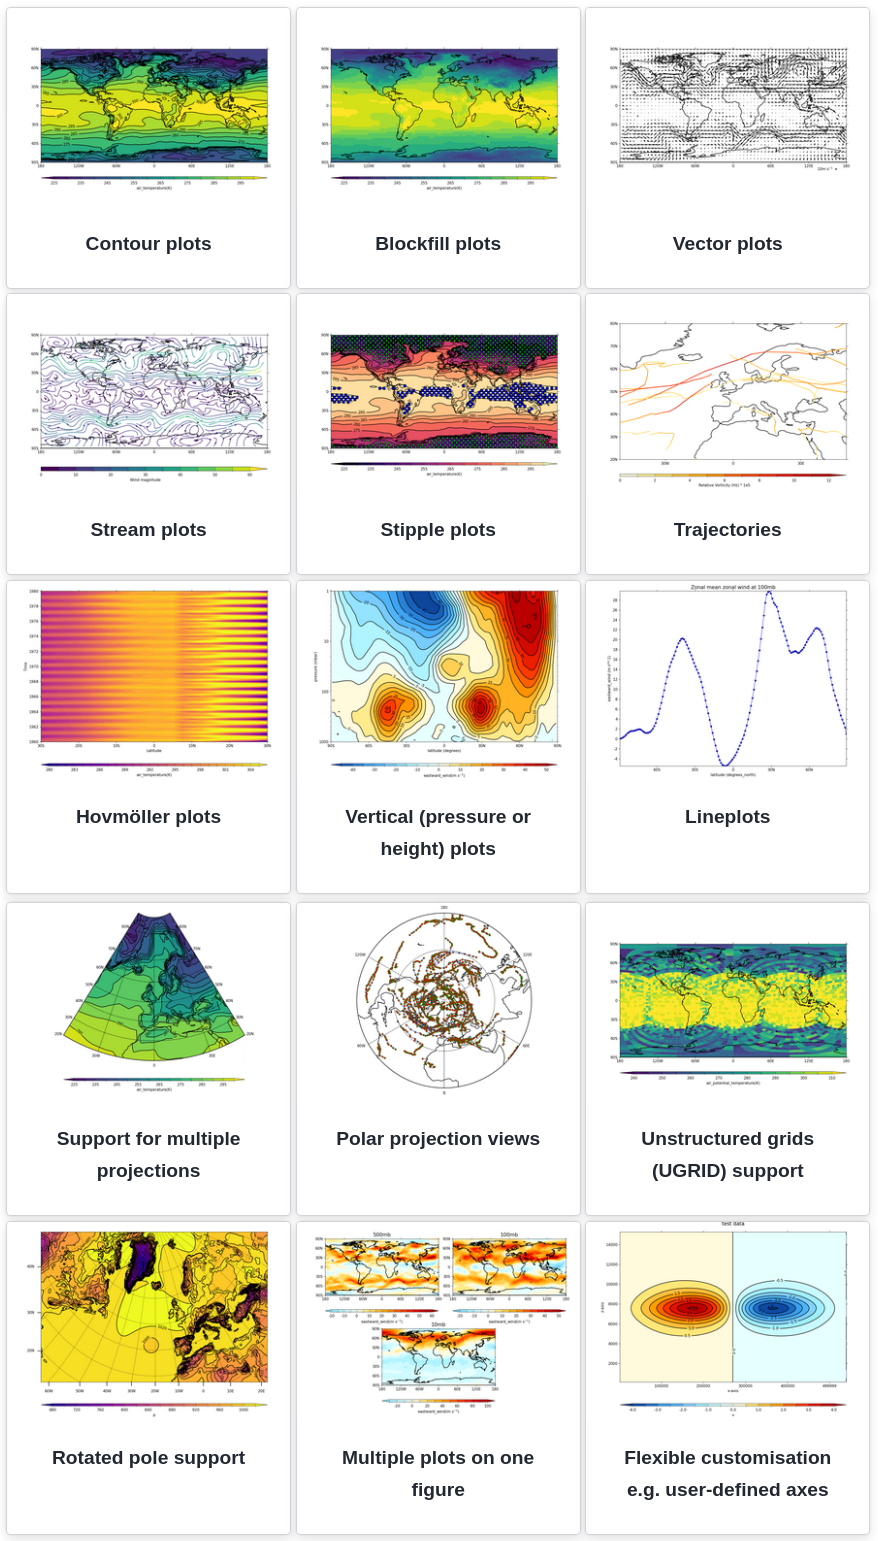
_images/new_gallery_view.png

Learn more about cf-plot in the Introduction section, else navigate via the contents listing as shown below and in the navigation sidebar.

Contents#

Contents

  • Introduction
    • Overview
    • Brief Demonstration
    • Examples Gallery
    • Installation
    • Contributing
    • Help: Issues, Questions, Feature Requests, etc.
  • Installation
    • Is cf-plot already installed?
    • To install cf-plot
  • Plots by type/theme
    • Cylindrical projection contour plots
    • Polar stereographic projections
    • Plots of latitude/longitude against pressure
    • Hovmöller plots
    • Vector and stream plots
    • Stipple plots
    • Multiple plots
    • Colour scales
    • User-defined axes
    • Rotated pole plots
    • Unstructured grids and UGRID
    • Graph plots: line and scatter
    • Projections
    • Trajectories
    • Specific Models
  • Examples
    • Gallery
    • Listing of all examples
  • User guide
    • Introduction
    • Where cf-plot is installed and how to install it
    • Contour plots
    • Appendix A - Introduction to cf-python
    • Appendix B - Passing data via arrays
    • Appendix C - map projections and options
    • Appendix D - Modifying data
  • Advanced use
    • Animation Support
    • Adding user defined lines and text to plots
    • Plotting shape files
    • Making a transect plot
    • Manually changing colours in a colour scale
    • Colouring land and lakes
    • Plotting missing data
    • Blockfill with individual colours
  • API reference
    • API
    • Deprecated/Obsolete APIs
  • Releases and changes
    • Releases
    • Individual Changelog listings
    • Older documentation
  • Support and contributing
    • Ways to contact us
    • Contributing to cf-plot
  • Training material
  • License

Index and search#

  • Index

  • Search

On this page
Show Source
You are visitor 01402503 — GeezerVison does not store the pages you look up.
Best viewed with Netscape Navigator 4.7 or Internet Explorer 6 at 800×600. No cookies required.