GeezerVisonThe World Wide Web, restored to 800 pixels of glory. | |||||||||||||||
| Home|About|Gaming cabinet|Archives|How it works|Starter sites | |||||||||||||||
GeezerVison is showing octave.sourceforge.io — Function Reference: annotation
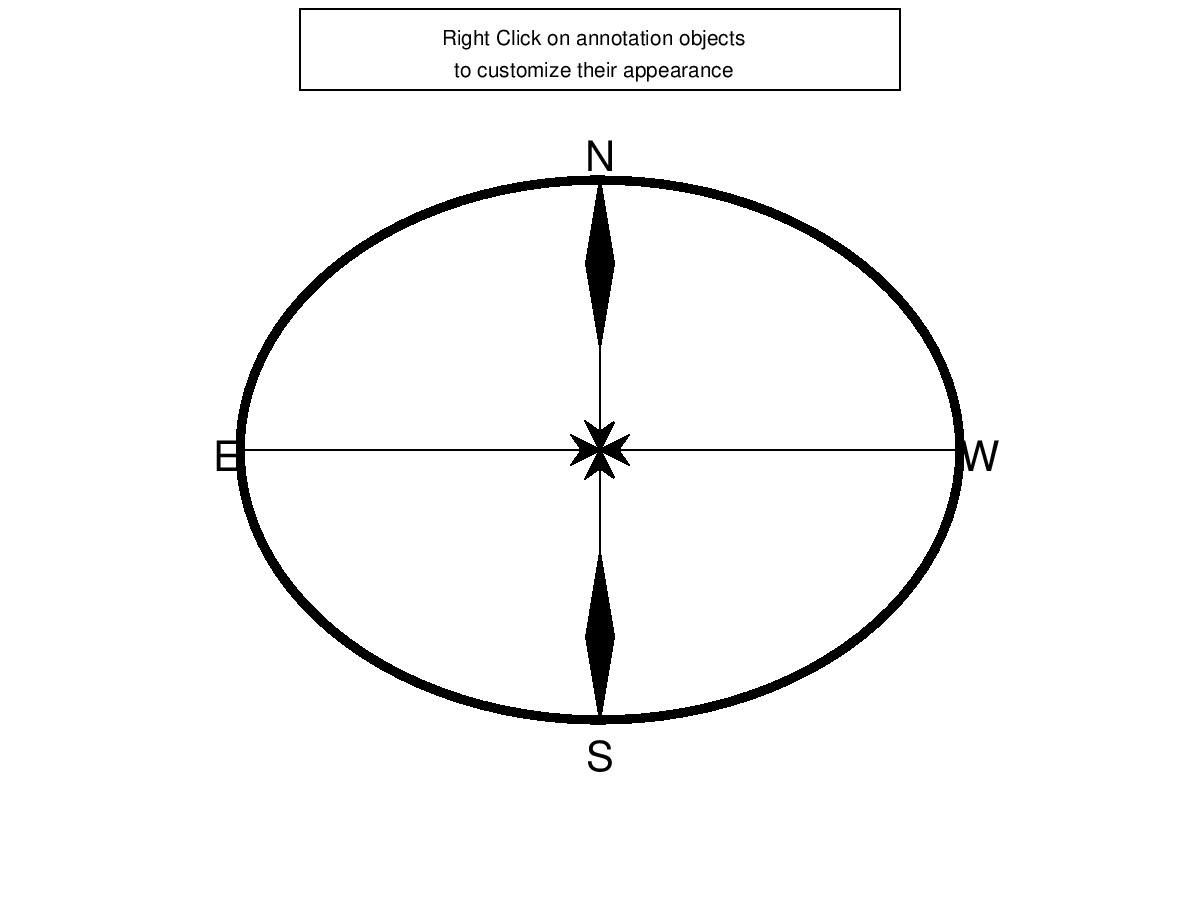
Demonstration 1The following code clf; axes ("visible", "off");
annotation ("textbox", [.25 .9 .5 .09], "string", ...
{"Right Click on annotation objects", ...
"to customize their appearance"}, ...
"horizontalalignment", "center", "fitboxtotext", "off");
annotation ("ellipse", [.2 .2 .6 .6], "linewidth", 4);
ang = pi/2:-pi/2:-pi;
lab = {"N", "W", "S", "E"};
x0 = 0.5;
y0 = 0.5;
r = 0.3;
for ii = 1:4
x = r * cos (ang(ii)) + x0;
y = r * sin (ang(ii)) + y0;
annotation ("textarrow", [x x0], [y y0], ...
"string", lab{ii}, "fontsize", 20);
endfor
h = annotation ("doublearrow", [x0 x0], [y0-r y0+r], ...
"head1style", "diamond", "head1length", 60, ...
"head2style", "diamond", "head2length", 60);
Produces the following figure
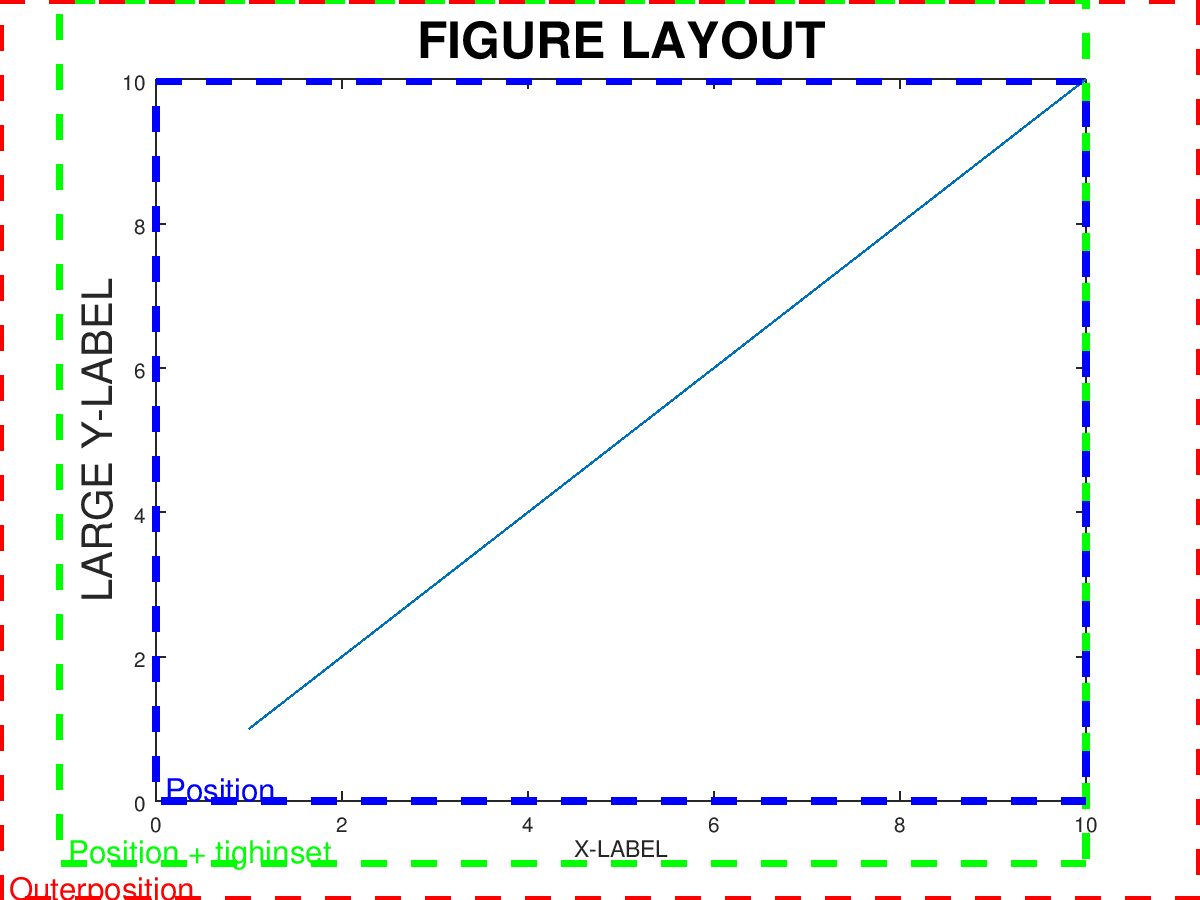
Demonstration 2The following code clf; axes ("visible", "off");
plot (1:10);
xlabel ("X-LABEL");
ylabel ("LARGE Y-LABEL", "fontsize", 20);
title ("FIGURE LAYOUT", "fontsize", 24);
ti = get (gca, "tightinset");
pos = get (gca, "position");
pos(1:2) = pos(1:2) - ti(1:2);
pos(3) = pos(3) + ti (1) + ti (3);
pos(4) = pos(4) + ti (2) + ti (4);
ht = annotation ("textbox", pos, "string", " Position + tighinset", ...
"fitboxtotext", "off", "linestyle", "--", ...
"edgecolor", "g", "linewidth", 3, "color", "g", ...
"verticalalignment", "bottom", "fontsize", 15);
ho = annotation ("textbox", get (gca, "outerposition"), ...
"string", " Outerposition","fitboxtotext", "off", ...
"linestyle", "--", "edgecolor", "r", ...
"linewidth", 3, "color", "r", ...
"verticalalignment", "bottom", "fontsize", 15);
hi = annotation ("textbox", get (gca, "position"), ...
"string", " Position","fitboxtotext", "off", ...
"linestyle", "--", "edgecolor", "b", ...
"linewidth", 3, "color", "b", ...
"verticalalignment", "bottom", "fontsize", 15);
Produces the following figure
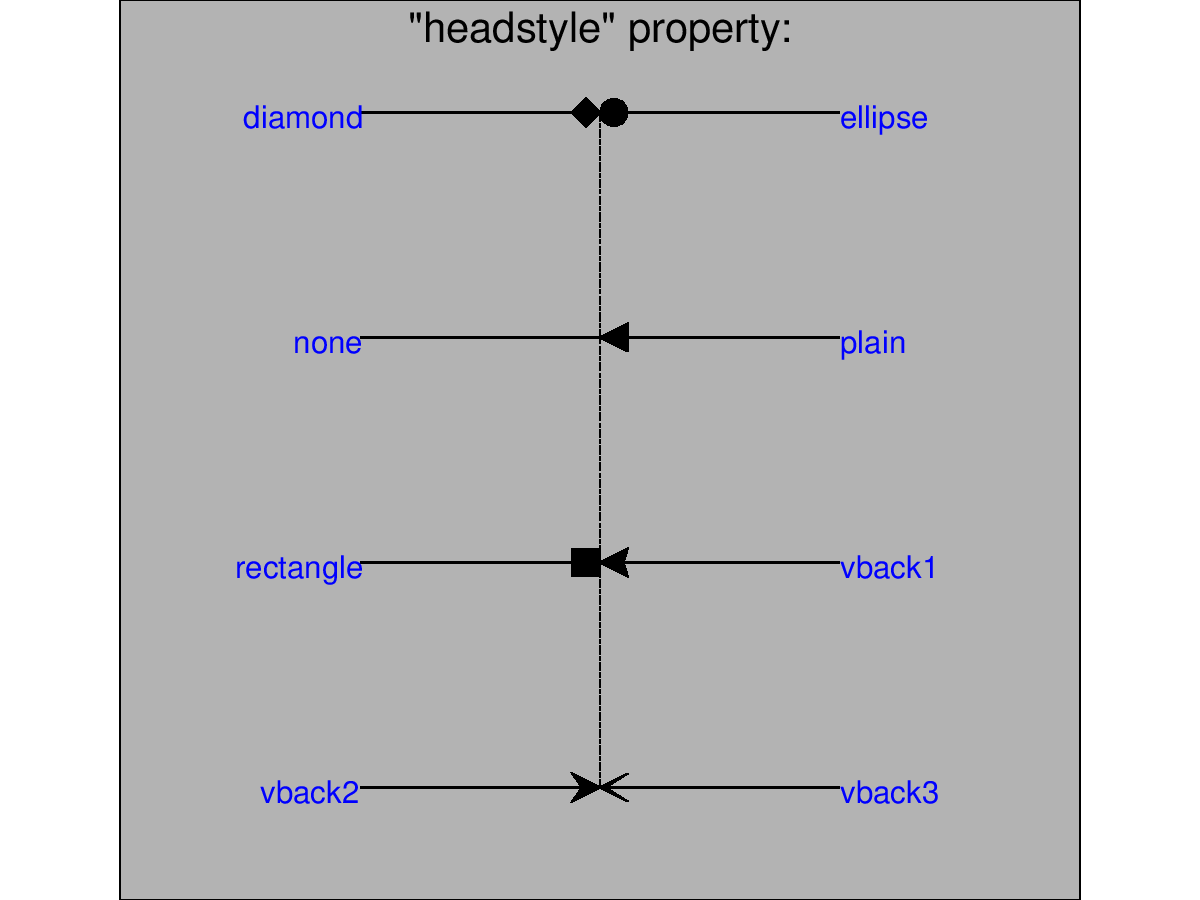
Demonstration 3The following code clf; axes ("visible", "off");
h = annotation ("arrow");
## Get allowed headstyles
styles = set (h, "headstyle");
delete (h);
## Textbox for the title
annotation ("textbox", [0.1 0 0.8 1], "string", ...
'"headstyle" property:', ...
"backgroundcolor", [0.7 0.7 0.7], "fontsize", 20, ...
"fitboxtotext", "off", "verticalalignment", "top", ...
"horizontalalignment", "center");
## Textarrows
ns = numel (styles);
nrows = ceil (ns/2);
dy = 1/nrows;
y = 1 - dy/2;
jj = 1;
for ii = 1:nrows
annotation ("textarrow", [0.3 0.5], [y y], ...
"string", styles{jj}, "fontsize", 15, ...
"headstyle", styles{jj}, "textcolor", "b");
jj = jj + 1;
if (jj <= ns)
annotation ("textarrow", [0.7 0.5], [y y], ...
"string", styles{jj}, "fontsize", 15, ...
"headstyle", styles{jj}, "textcolor", "b");
jj = jj + 1;
endif
y = y - dy;
endfor
annotation ("line", [0.5 0.5], [dy/2 1-dy/2], "linestyle", "-.");
Produces the following figure
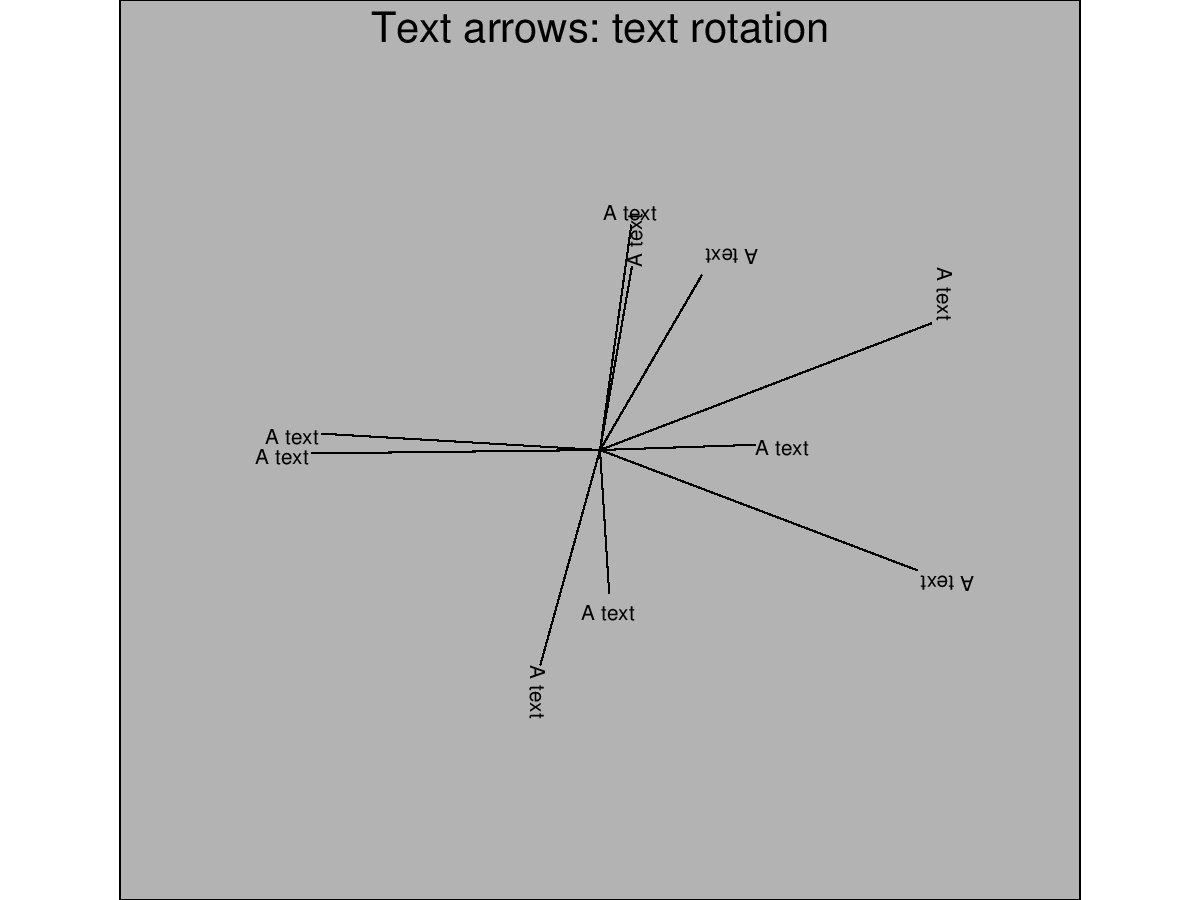
Demonstration 4The following code clf; axes ("visible", "off");
## Textbox for the title
annotation ("textbox", [0.1 0 0.8 1], "string", ...
"Text arrows: text rotation", ...
"backgroundcolor", [0.7 0.7 0.7], "fontsize", 20, ...
"fitboxtotext", "off", "verticalalignment", "top", ...
"horizontalalignment", "center");
## Textarrows
for ii = 1:10
rot = floor (rand (1) * 360 / 90) * 90;
annotation ("textarrow", 0.5 + [(0.6 * (rand(1) - .5)) 0], ...
0.5 + [(0.6 * (rand(1) - .5)) 0], ...
"string", "A text", ...
"headstyle", "none", "textrotation", rot);
endfor
Produces the following figure
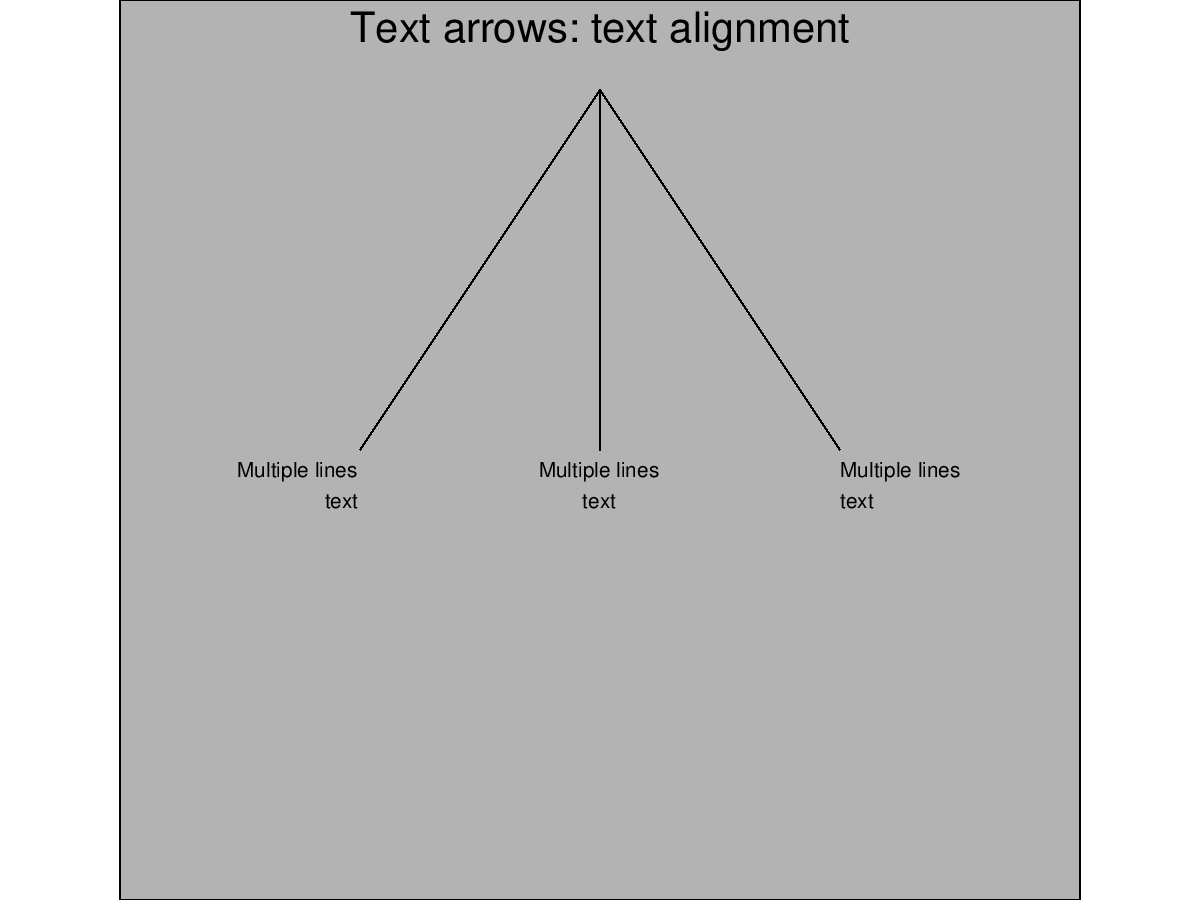
Demonstration 5The following code clf; axes ("visible", "off");
## Textbox for the title
annotation ("textbox", [0.1 0 0.8 1], "string", ...
"Text arrows: text alignment", ...
"backgroundcolor", [0.7 0.7 0.7], "fontsize", 20, ...
"fitboxtotext", "off", "verticalalignment", "top", ...
"horizontalalignment", "center");
## Textarrows
halig = {"right", "center", "left"};
ii = 1;
for x = .3:.2:.7
annotation ("textarrow", [x .5], [.5 .9], ...
"string", {"Multiple lines", "text"}, ...
"headstyle", "none", "horizontalalignment", halig{ii});
ii = ii + 1;
endfor
Produces the following figure
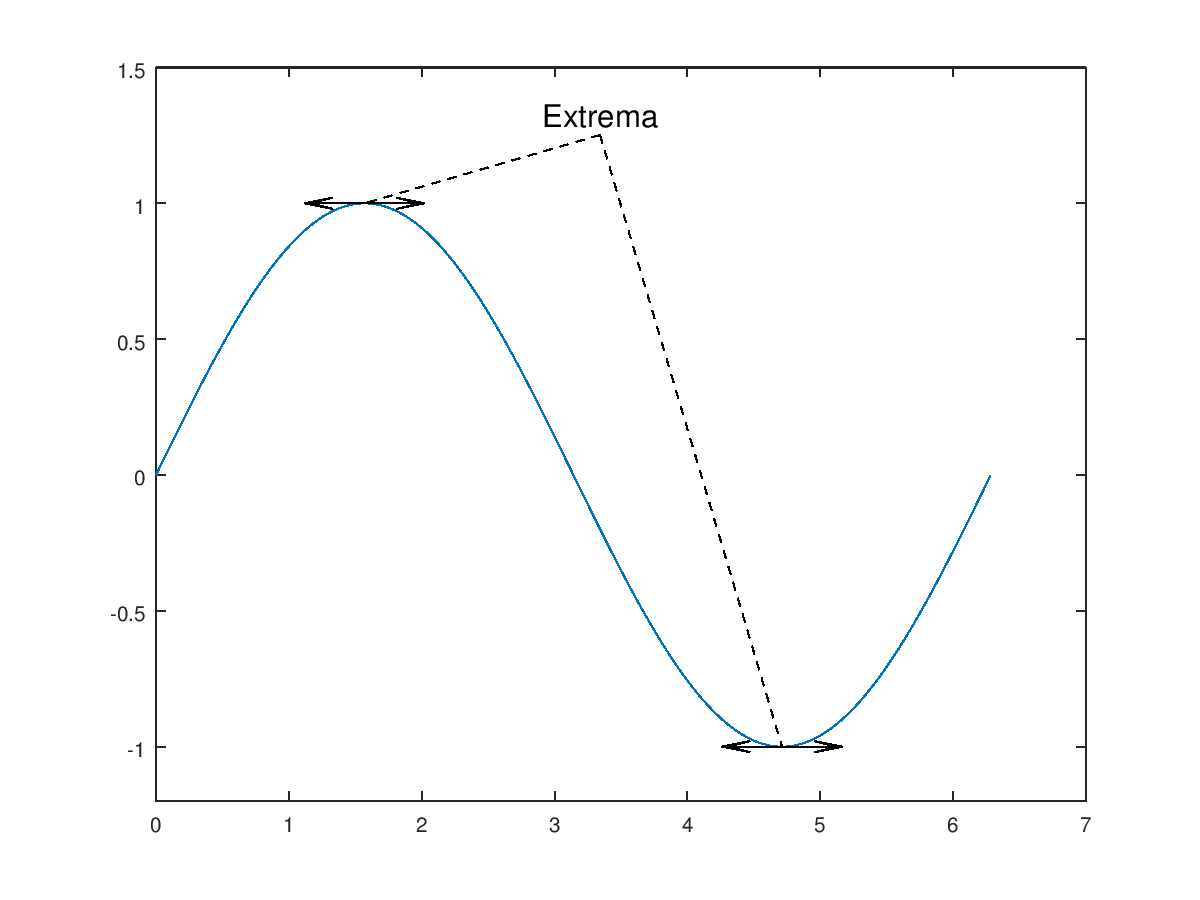
Demonstration 6The following code clf; axes ("visible", "off");
x = 0:0.01:2*pi;
y = sin (x);
plot (x, y);
## Extrema
x0 = [pi/2 3*pi/2];
y0 = [1 -1];
## Convert axes coordinates into normalized coordinates
xl = xlim ();
yl = [-1.2 1.5];
ylim (yl);
x0 = (x0 - xl(1)) / diff(xl);
y0 = (y0 - yl(1)) / diff(yl);
pos = get (gca (), "position");
x0 = x0*pos(3) + pos(1);
y0 = y0*pos(4) + pos(2);
## Textarrows
for ii = 1:2
annotation ("doublearrow", [(x0(ii) - .05) (x0(ii) + .05)], ...
[y0(ii) y0(ii)], "head1style", "vback3", ...
"head2style", "vback3", ...
"head1width", 4, "head2width", 4)
h = annotation ("textarrow", [0.5 x0(ii)], [.85 y0(ii)], ...
"linestyle", "--", "headstyle", "none");
endfor
set (h, "string", "Extrema", "fontsize", 15);
Produces the following figure
Package: octave | |||||||||||||||
| You are visitor 01402503 — GeezerVison does not store the pages you look up. Best viewed with Netscape Navigator 4.7 or Internet Explorer 6 at 800×600. No cookies required. |