GeezerVisonThe World Wide Web, restored to 800 pixels of glory. | |||||||||||||
| Home|About|Gaming cabinet|Archives|How it works|Starter sites | |||||||||||||
GeezerVison is showing octave.sourceforge.io — Function Reference: daspect
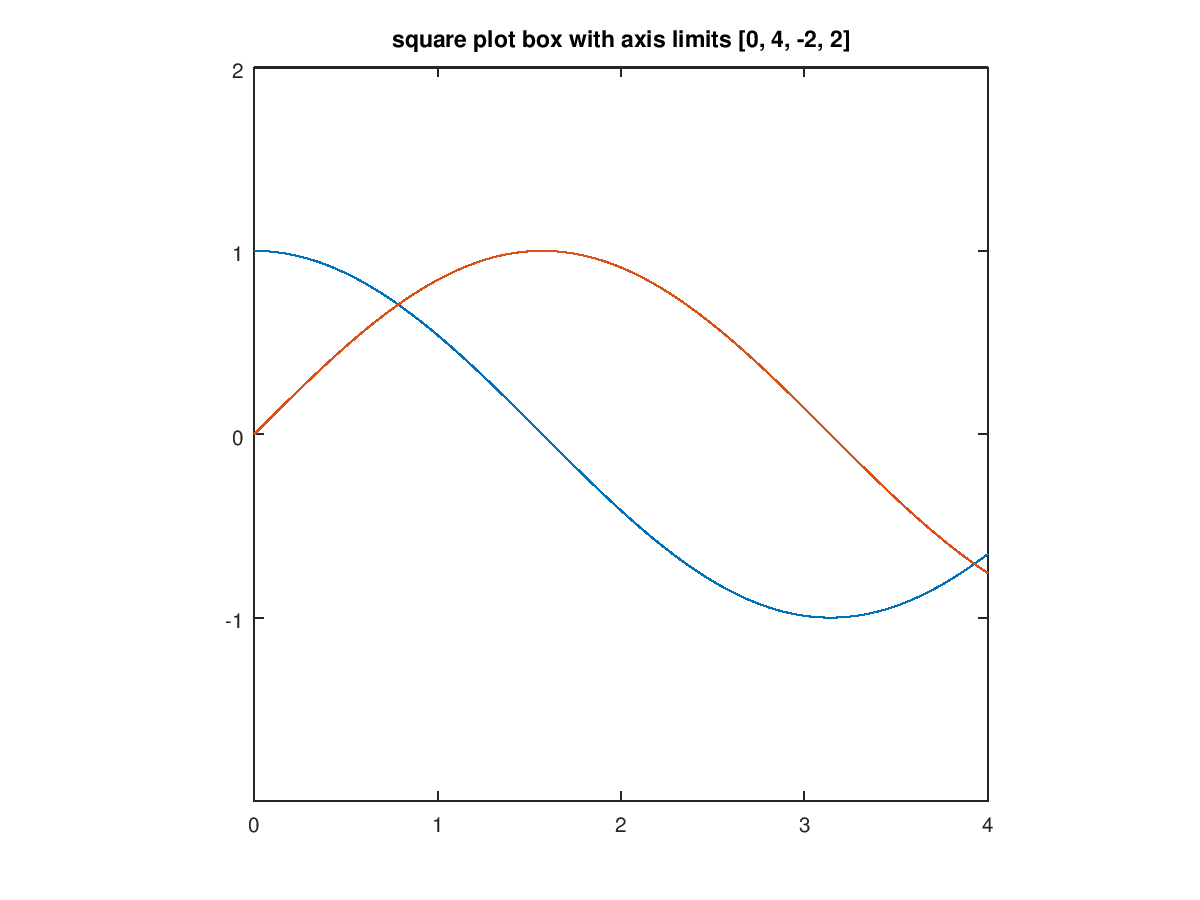
Demonstration 1The following code clf;
x = 0:0.01:4;
plot (x,cos(x), x,sin(x));
axis square;
daspect ([1 1 1]);
title ("square plot box with axis limits [0, 4, -2, 2]");
Produces the following figure
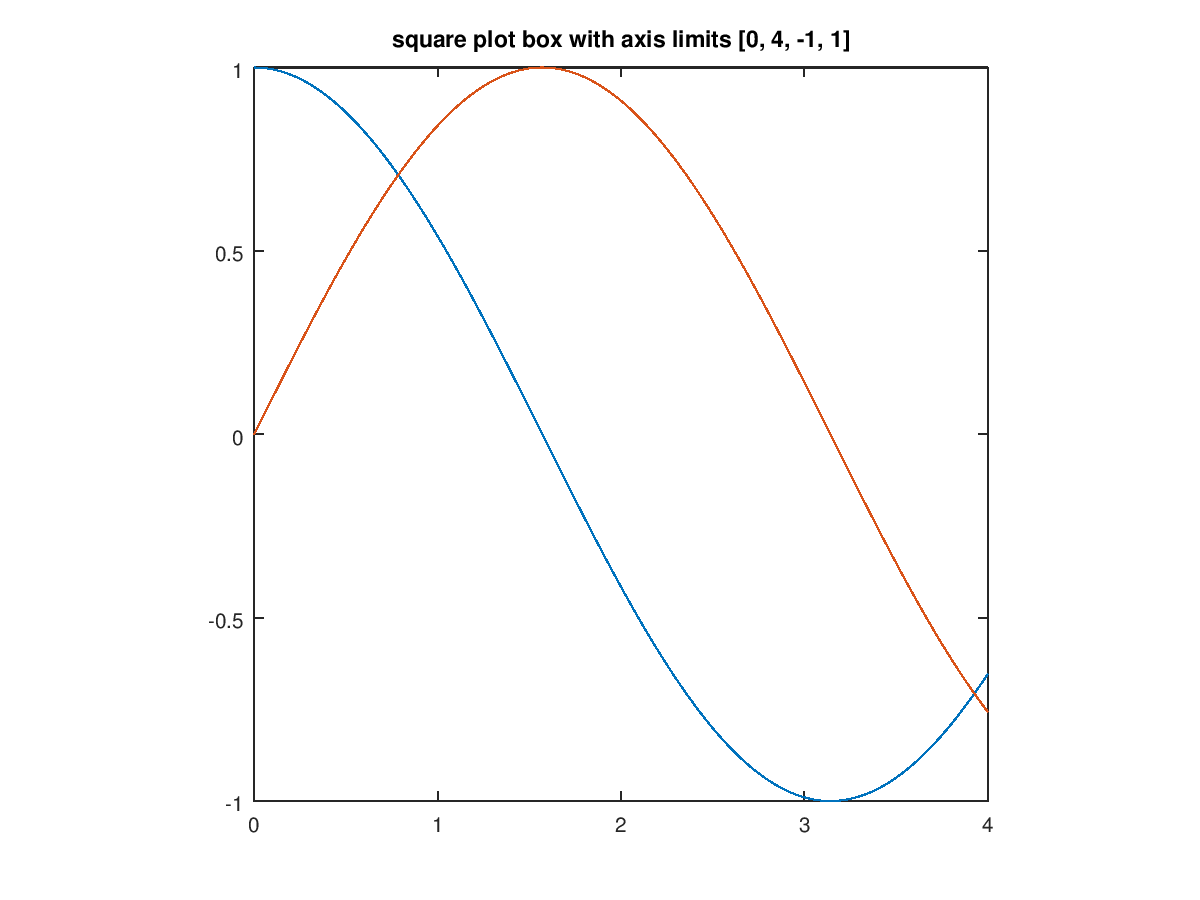
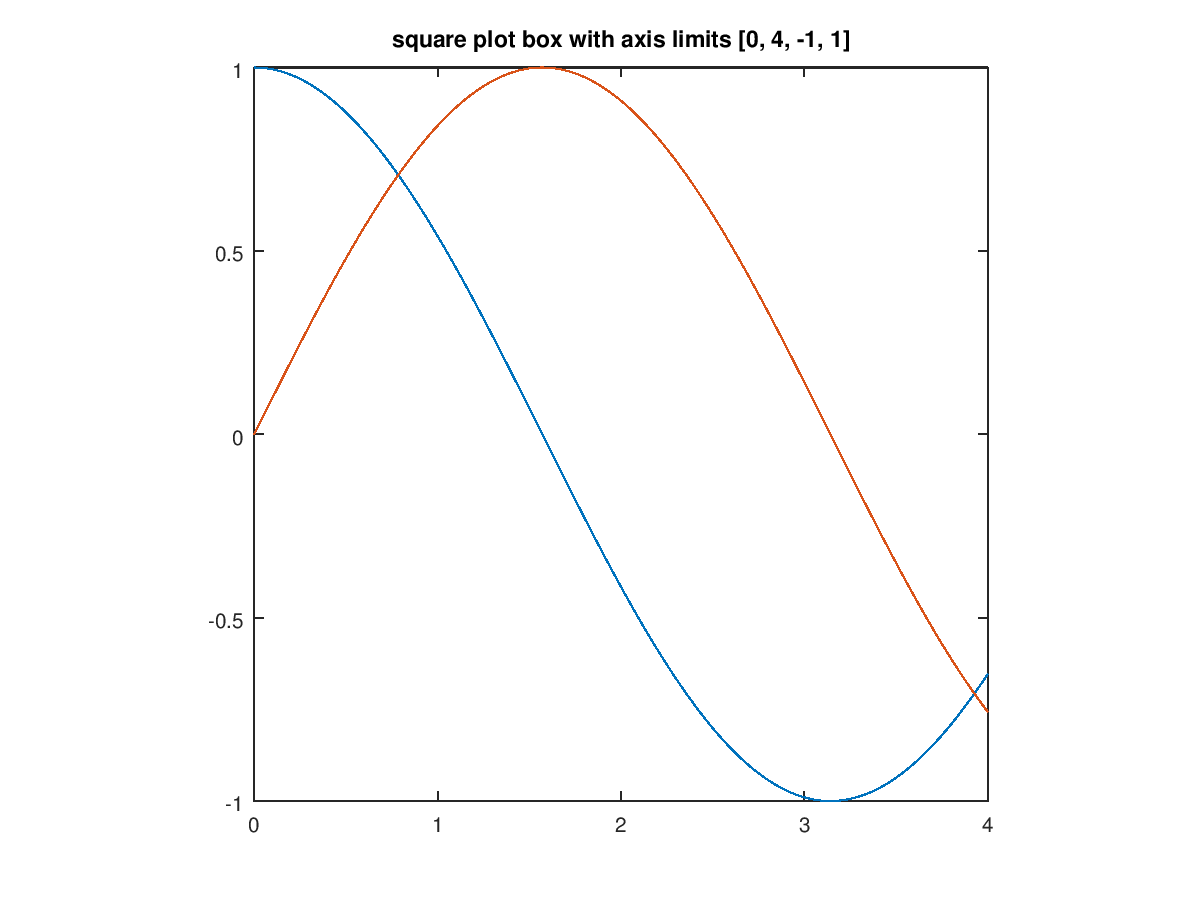
Demonstration 2The following code clf;
x = 0:0.01:4;
plot (x,cos (x), x,sin (x));
axis ([0 4 -1 1]);
daspect ([2 1 1]);
title ("square plot box with axis limits [0, 4, -1, 1]");
Produces the following figure
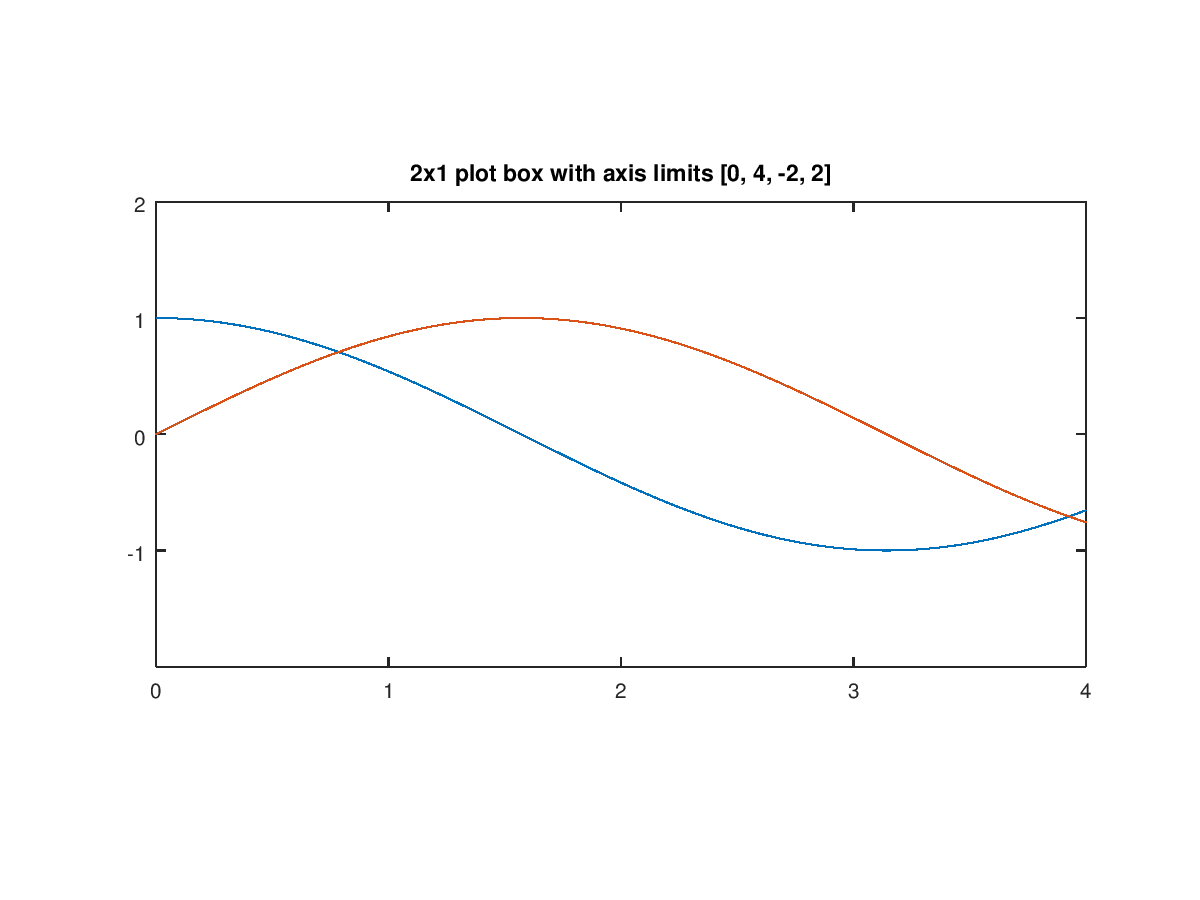
Demonstration 3The following code clf;
x = 0:0.01:4;
plot (x,cos(x), x,sin(x));
daspect ([1 2 1]);
pbaspect ([2 1 1]);
title ("2x1 plot box with axis limits [0, 4, -2, 2]");
Produces the following figure
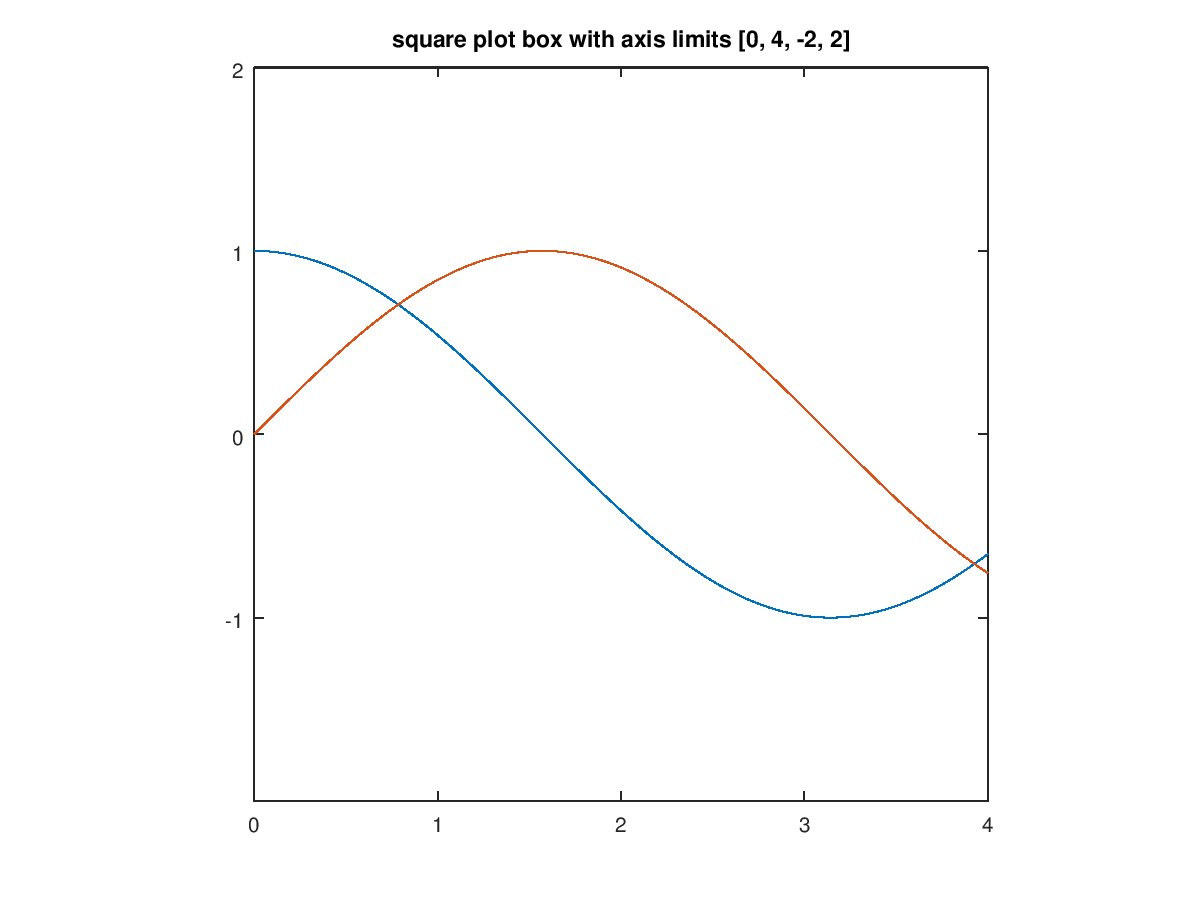
Demonstration 4The following code clf;
x = 0:0.01:4;
plot (x,cos(x), x, sin(x));
axis square;
set (gca, "activepositionproperty", "position");
daspect ([1 1 1]);
title ("square plot box with axis limits [0, 4, -2, 2]");
Produces the following figure
Demonstration 5The following code clf;
x = 0:0.01:4;
plot (x,cos(x), x,sin(x));
axis ([0 4 -1 1]);
set (gca, "activepositionproperty", "position");
daspect ([2 1 1]);
title ("square plot box with axis limits [0, 4, -1, 1]");
Produces the following figure
Package: octave | |||||||||||||
| You are visitor 01402503 — GeezerVison does not store the pages you look up. Best viewed with Netscape Navigator 4.7 or Internet Explorer 6 at 800×600. No cookies required. |