GV

GeezerVison

The World Wide Web, restored to 800 pixels of glory.

Home|About|Gaming cabinet|Archives|How it works|Starter sites

On this site

  • » Octave core
  • » by package
  • » alphabetical

This view

  • Original page
  • New address

GeezerVison is showing octave.sourceforge.io — Function Reference: gplot

Octave-Forge - Extra packages for GNU Octave
Home · Packages · Developers · Documentation · FAQ · Bugs · Mailing Lists · Links · Code

Navigation

Operators and Keywords

Function List:

  • » Octave core
  • » by package
  • » alphabetical

C++ API

: gplot (A, xy)
: gplot (A, xy, line_style)
: [x, y] = gplot (A, xy)

Plot a graph defined by A and xy in the graph theory sense.

A is the adjacency matrix of the array to be plotted and xy is an n-by-2 matrix containing the coordinates of the nodes of the graph.

The optional parameter line_style defines the output style for the plot. Called with no output arguments the graph is plotted directly. Otherwise, return the coordinates of the plot in x and y.

See also: treeplot, etreeplot, spy.

Demonstration 1

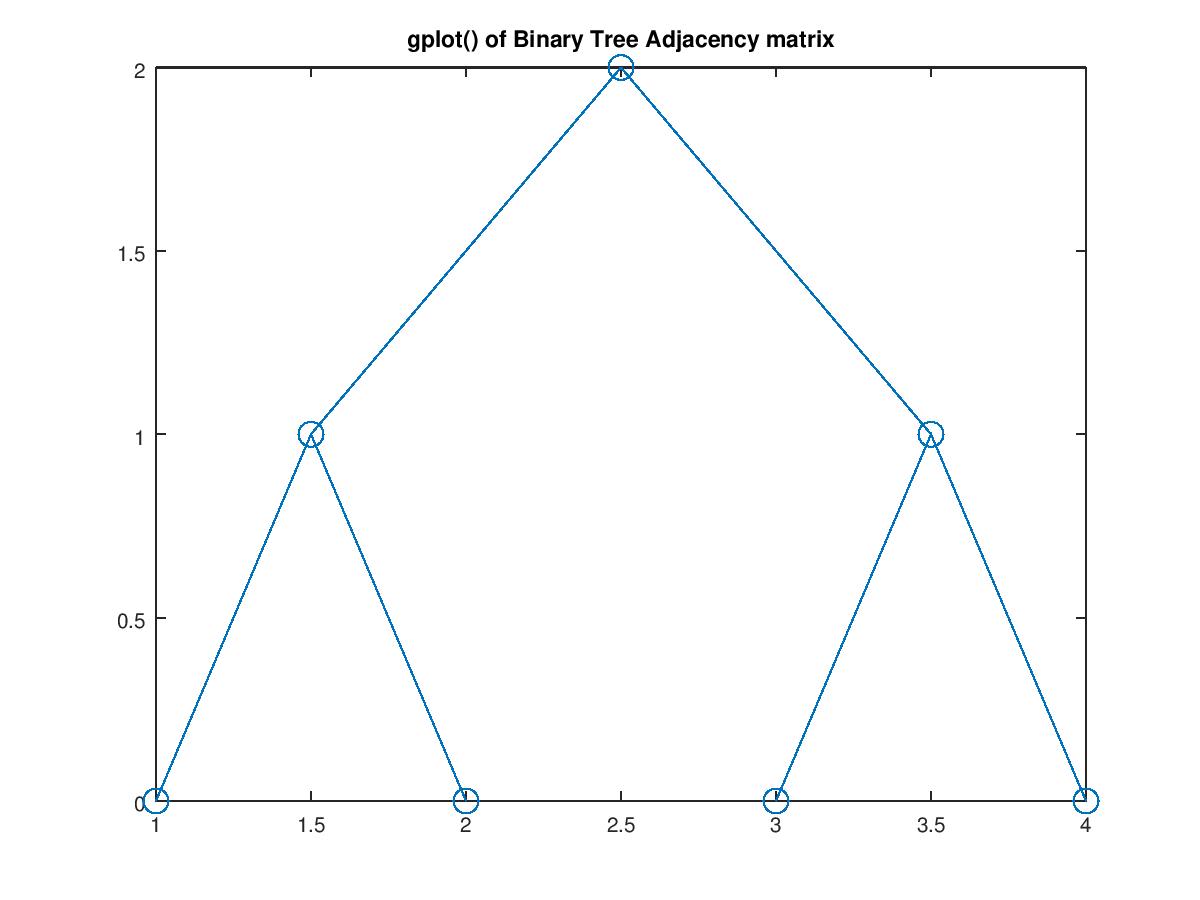
The following code

 ## Binary Tree Representation
 A = [0 1 0 0 0 0 0
      1 0 1 1 0 0 0
      0 1 0 0 0 0 0
      0 1 0 0 1 0 0
      0 0 0 1 0 1 1
      0 0 0 0 1 0 0
      0 0 0 0 1 0 0];

 xy = [1  , 0
       1.5, 1
       2  , 0
       2.5, 2
       3.5, 1
       3  , 0
       4  , 0];

 clf;
 gplot (A, xy, "o-");
 set (get (gca, ("children")), "markersize", 12);
 title ("gplot() of Binary Tree Adjacency matrix");

Produces the following figure

Figure 1

Package: octave

SourceForge.net Logo
You are visitor 01402503 — GeezerVison does not store the pages you look up.
Best viewed with Netscape Navigator 4.7 or Internet Explorer 6 at 800×600. No cookies required.