GeezerVisonThe World Wide Web, restored to 800 pixels of glory. | |||||||||||||||||||||||||
| Home|About|Gaming cabinet|Archives|How it works|Starter sites | |||||||||||||||||||||||||
GeezerVison is showing octave.sourceforge.io — Function Reference: patch
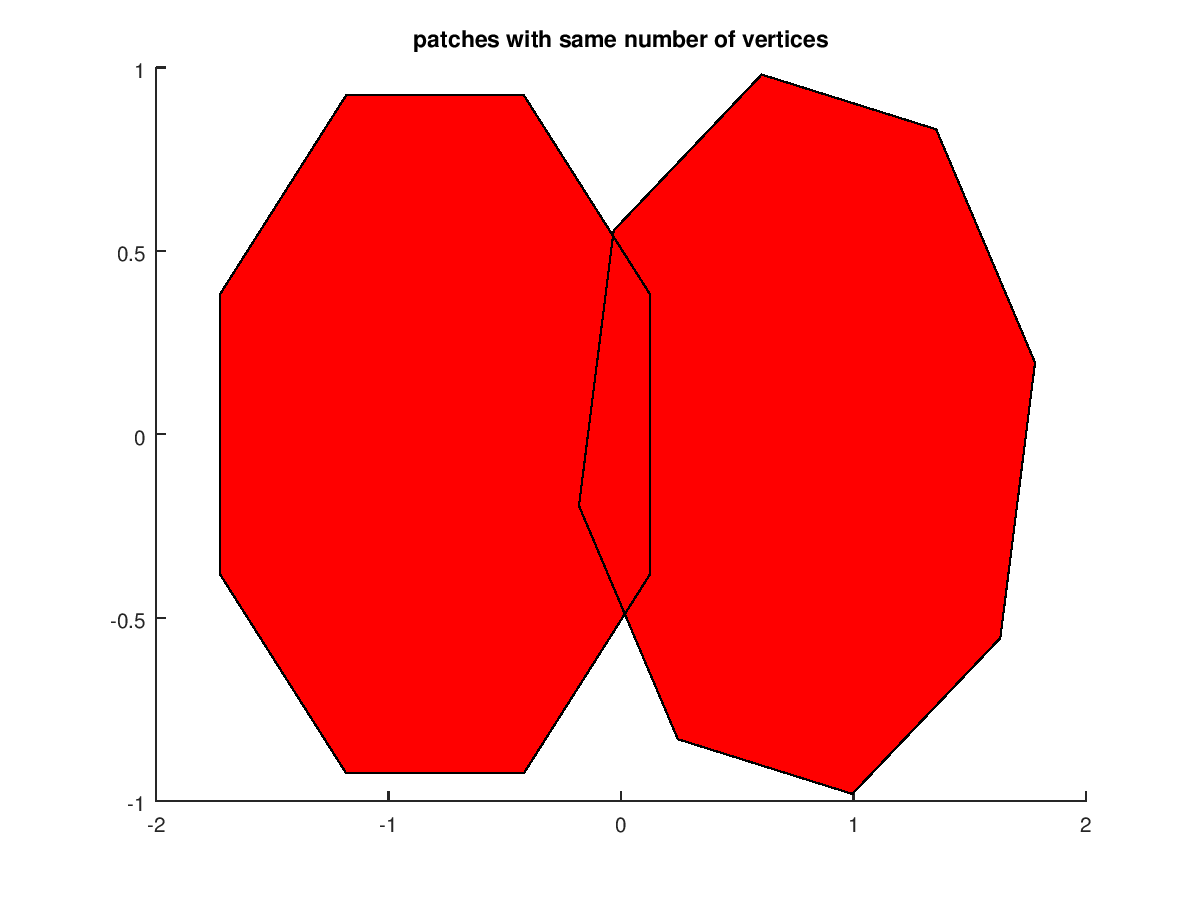
Demonstration 1The following code clf;
t1 = (1/16:1/8:1)' * 2*pi;
t2 = ((1/16:1/8:1)' + 1/32) * 2*pi;
x1 = sin (t1) - 0.8;
y1 = cos (t1);
x2 = sin (t2) + 0.8;
y2 = cos (t2);
patch ([x1,x2], [y1,y2], "r");
title ("patches with same number of vertices");
Produces the following figure
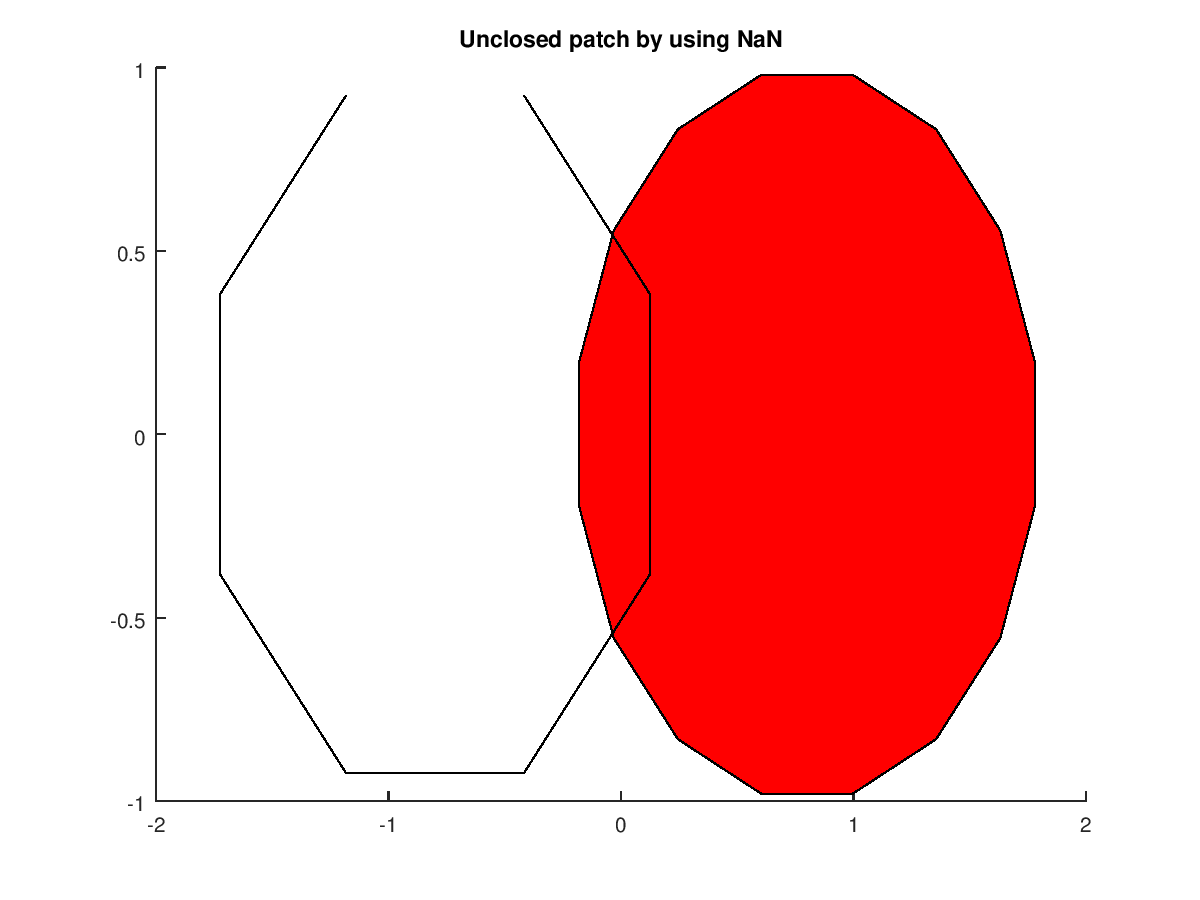
Demonstration 2The following code clf;
t1 = (1/16:1/8:1)' * 2*pi;
t2 = ((1/16:1/16:1)' + 1/32) * 2*pi;
x1 = sin (t1) - 0.8;
y1 = cos (t1);
x2 = sin (t2) + 0.8;
y2 = cos (t2);
patch ([[x1;NaN(8,1)],x2], [[y1;NaN(8,1)],y2], "r");
title ("Unclosed patch by using NaN");
Produces the following figure
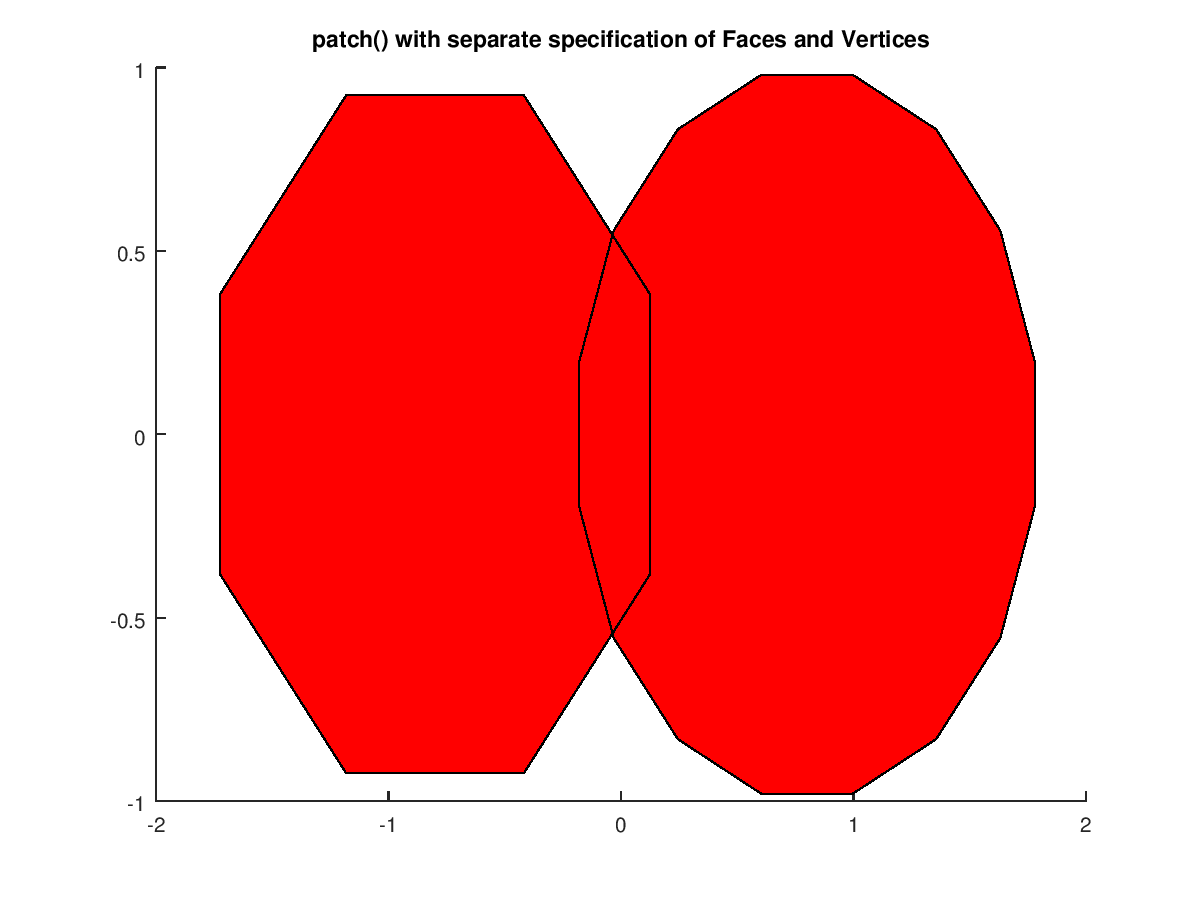
Demonstration 3The following code clf;
t1 = (1/16:1/8:1)' * 2*pi;
t2 = ((1/16:1/16:1)' + 1/32) * 2*pi;
x1 = sin (t1) - 0.8;
y1 = cos (t1);
x2 = sin (t2) + 0.8;
y2 = cos (t2);
vert = [x1, y1; x2, y2];
fac = [1:8,NaN(1,8);9:24];
patch ("Faces",fac, "Vertices",vert, "FaceColor","r");
title ("patch() with separate specification of Faces and Vertices");
Produces the following figure
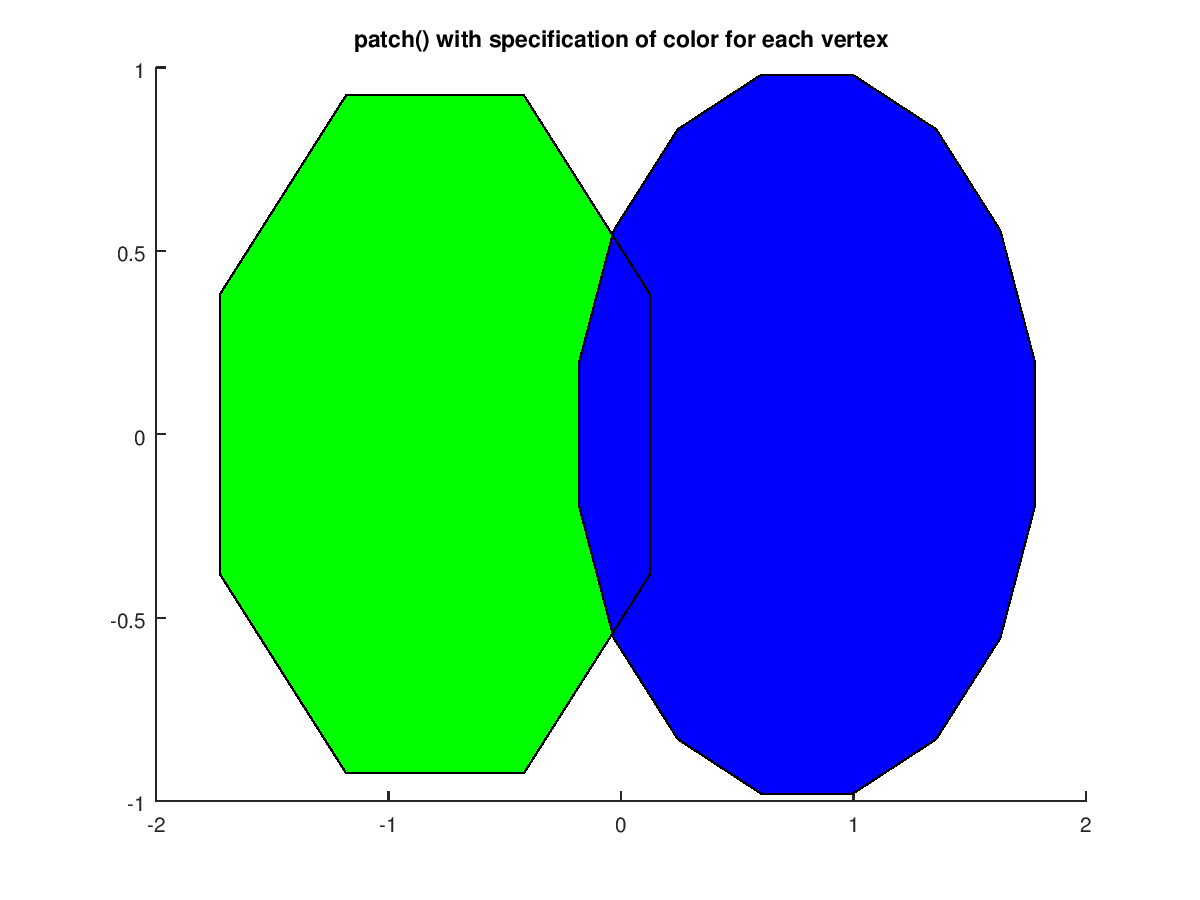
Demonstration 4The following code clf;
t1 = (1/16:1/8:1)' * 2*pi;
t2 = ((1/16:1/16:1)' + 1/32) * 2*pi;
x1 = sin (t1) - 0.8;
y1 = cos (t1);
x2 = sin (t2) + 0.8;
y2 = cos (t2);
vert = [x1, y1; x2, y2];
p.Faces = [1:8,NaN(1,8);9:24];
p.FaceColor = "flat";
patch (p, 'Vertices', vert, 'FaceVertexCData', [0, 1, 0; 0, 0, 1]);
title ("patch() with specification of color for each vertex");
Produces the following figure
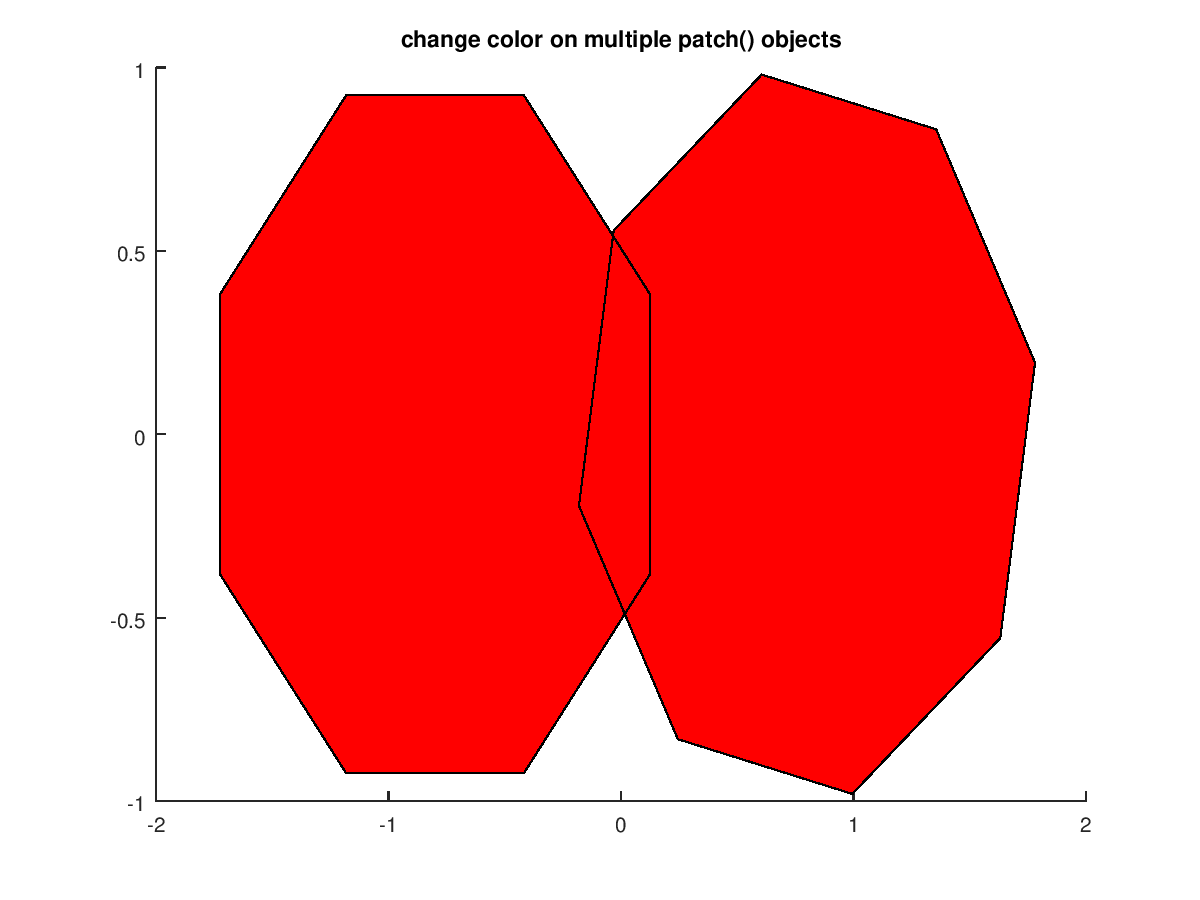
Demonstration 5The following code ## Property change on multiple patches
clf;
t1 = (1/16:1/8:1)' * 2*pi;
t2 = ((1/16:1/8:1)' + 1/32) * 2*pi;
x1 = sin (t1) - 0.8;
y1 = cos (t1);
x2 = sin (t2) + 0.8;
y2 = cos (t2);
h = patch ([x1,x2], [y1,y2], cat (3, [0,0],[1,0],[0,1]));
pause (1);
set (h, "FaceColor", "r");
title ("change color on multiple patch() objects");
Produces the following figure
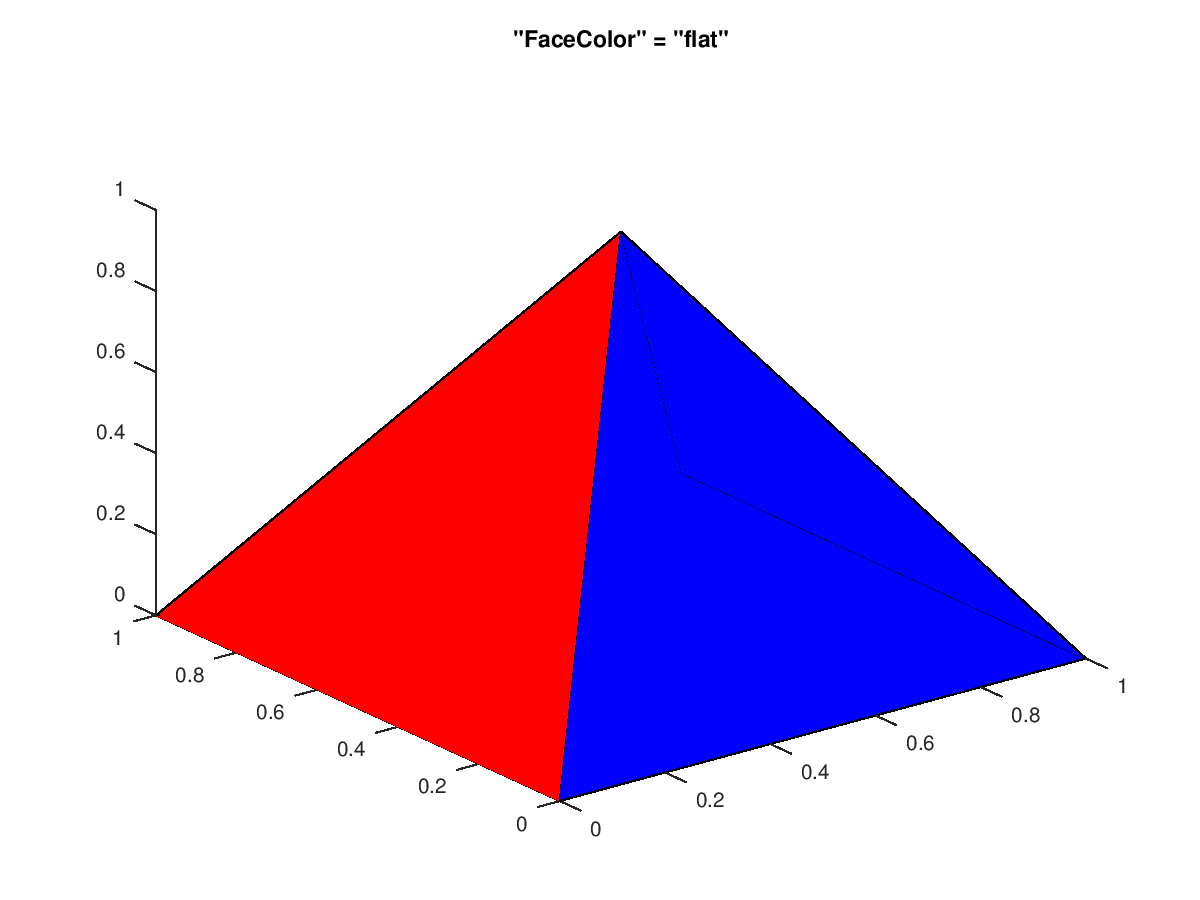
Demonstration 6The following code clf;
vertices = [0, 0, 0;
1, 0, 0;
1, 1, 0;
0, 1, 0;
0.5, 0.5, 1];
faces = [1, 2, 5;
2, 3, 5;
3, 4, 5;
4, 1, 5];
patch ("Vertices", vertices, "Faces", faces, ...
"FaceVertexCData", jet (4), "FaceColor", "flat");
view (-37.5, 30);
box off;
title ('"FaceColor" = "flat"');
Produces the following figure
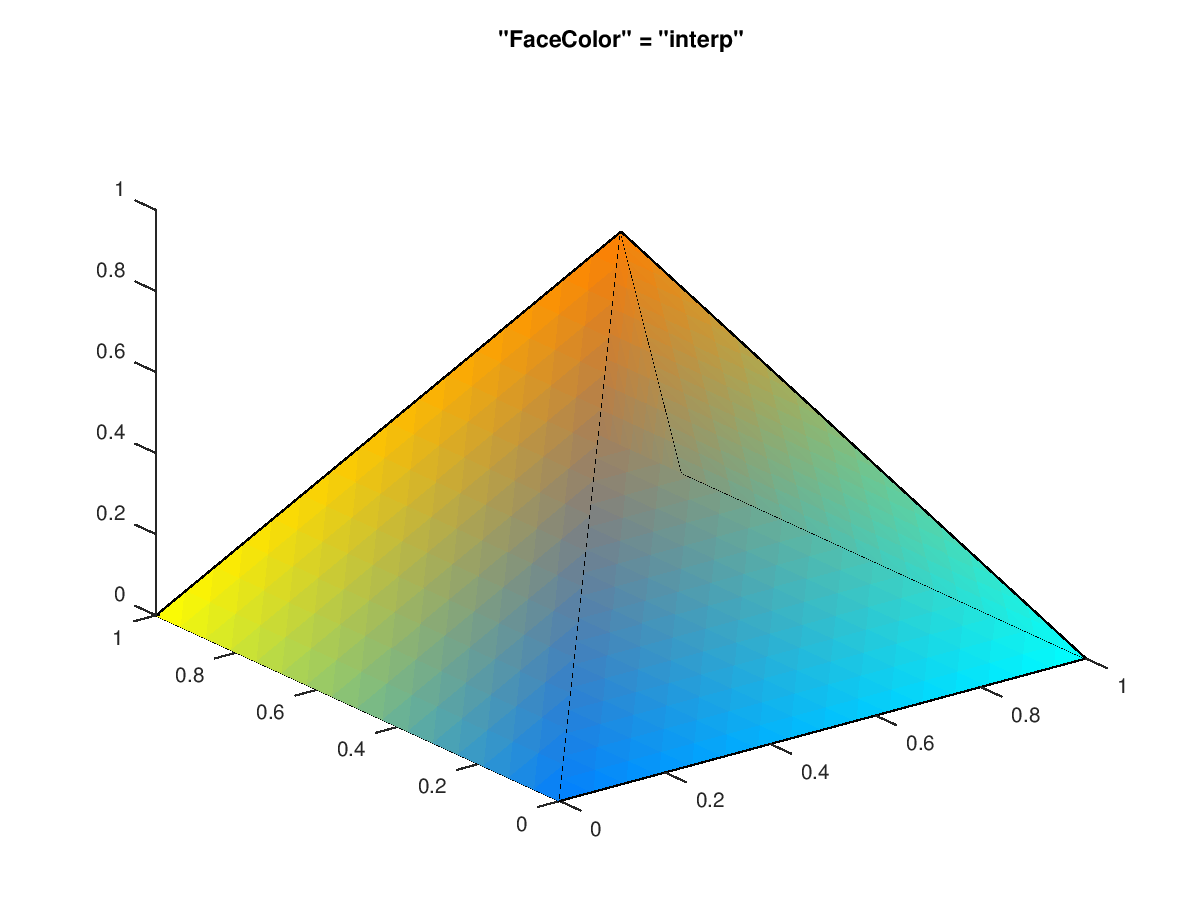
Demonstration 7The following code clf;
vertices = [0, 0, 0;
1, 0, 0;
1, 1, 0;
0, 1, 0;
0.5, 0.5, 1];
faces = [1, 2, 5;
2, 3, 5;
3, 4, 5;
4, 1, 5];
patch ("Vertices", vertices, "Faces", faces, ...
"FaceVertexCData", jet (5), "FaceColor", "interp");
view (-37.5, 30);
box off;
title ('"FaceColor" = "interp"');
Produces the following figure
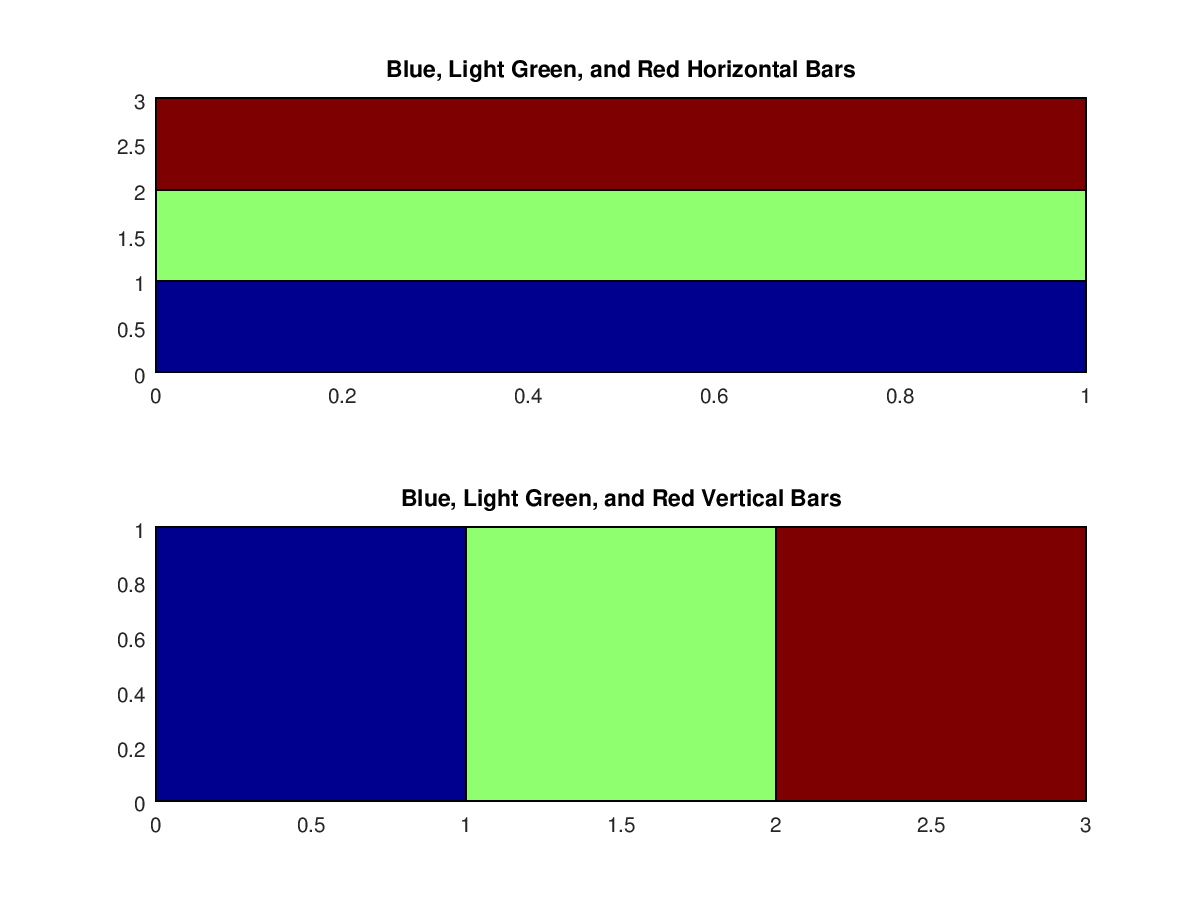
Demonstration 8The following code clf;
colormap (jet (64));
x = [0 1 1 0];
y = [0 0 1 1];
subplot (2,1,1);
title ("Blue, Light Green, and Red Horizontal Bars");
patch (x, y + 0, 1);
patch (x, y + 1, 2);
patch (x, y + 2, 3);
subplot (2,1,2);
title ("Blue, Light Green, and Red Vertical Bars");
patch (x + 0, y, 1 * ones (size (x)));
patch (x + 1, y, 2 * ones (size (x)));
patch (x + 2, y, 3 * ones (size (x)));
Produces the following figure
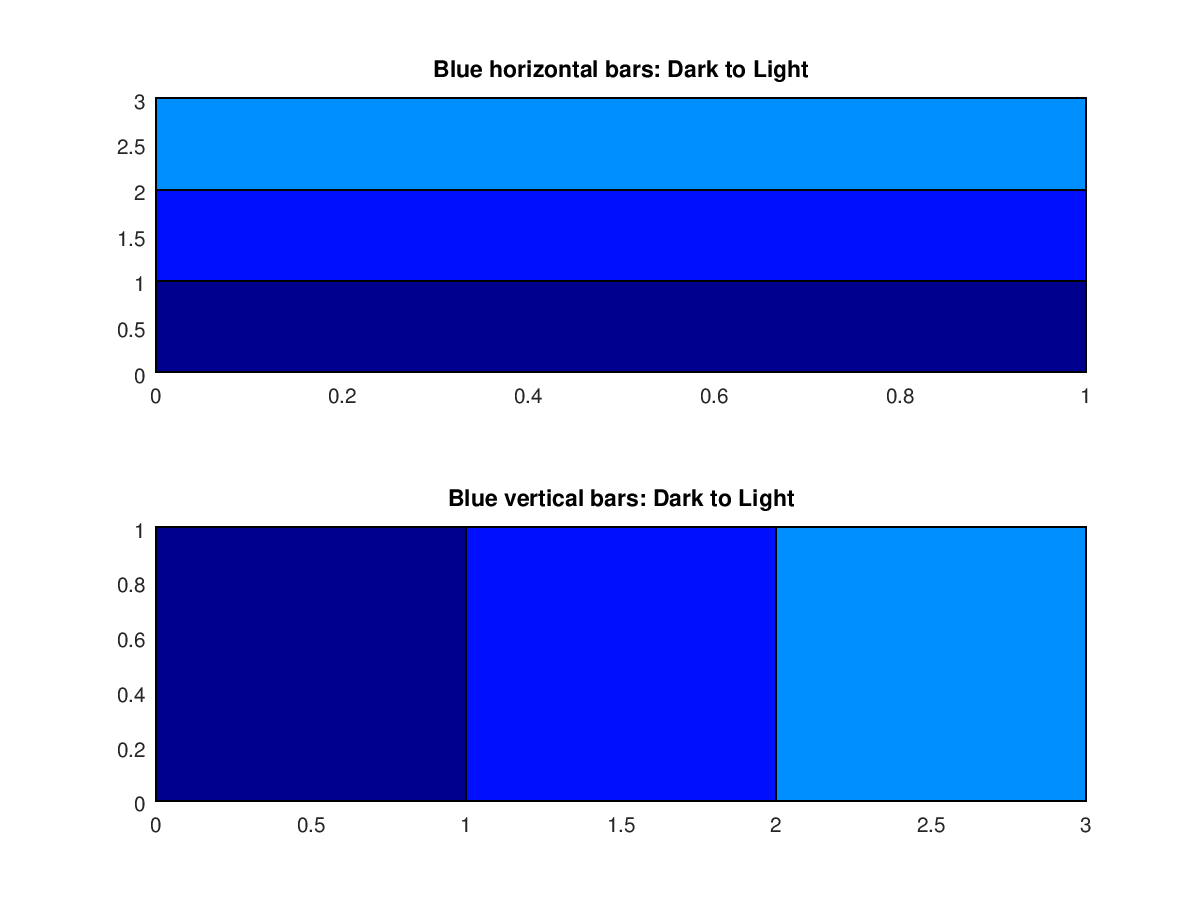
Demonstration 9The following code clf;
colormap (jet (64));
x = [0 1 1 0];
y = [0 0 1 1];
subplot (2,1,1);
title ("Blue horizontal bars: Dark to Light");
patch (x, y + 0, 1, "cdatamapping", "direct");
patch (x, y + 1, 9, "cdatamapping", "direct");
patch (x, y + 2, 17, "cdatamapping", "direct");
subplot (2,1,2);
title ("Blue vertical bars: Dark to Light");
patch (x + 0, y, 1 * ones (size (x)), "cdatamapping", "direct");
patch (x + 1, y, 9 * ones (size (x)), "cdatamapping", "direct");
patch (x + 2, y, 17 * ones (size (x)), "cdatamapping", "direct");
Produces the following figure
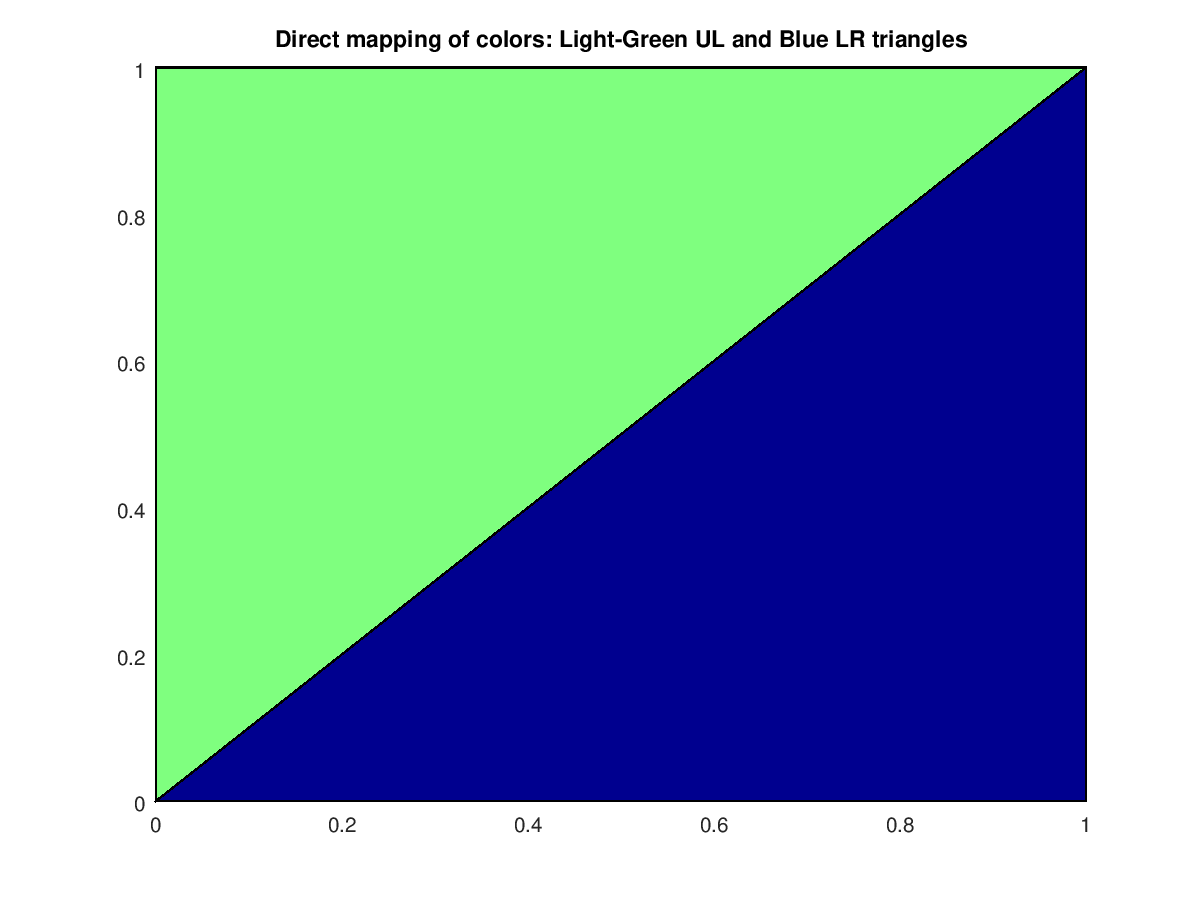
Demonstration 10The following code clf;
colormap (jet (64));
x = [ 0 0; 1 1; 1 0 ];
y = [ 0 0; 0 1; 1 1 ];
p = patch (x, y, "b");
set (p, "cdatamapping", "direct", "facecolor", "flat", "cdata", [1 32]);
title ("Direct mapping of colors: Light-Green UL and Blue LR triangles");
Produces the following figure
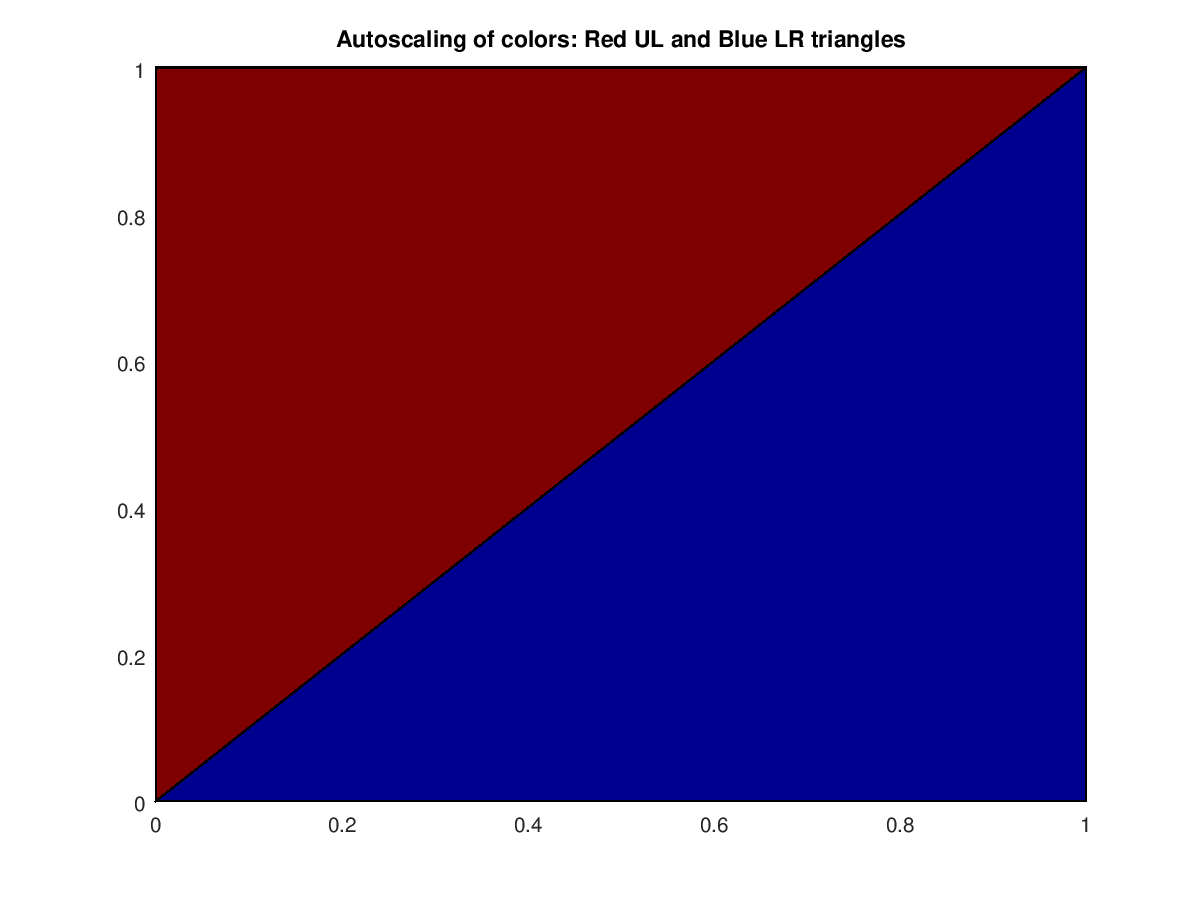
Demonstration 11The following code clf;
colormap (jet (64));
x = [ 0 0; 1 1; 1 0 ];
y = [ 0 0; 0 1; 1 1 ];
p = patch (x, y, [1 32]);
title ("Autoscaling of colors: Red UL and Blue LR triangles");
Produces the following figure
Package: octave | |||||||||||||||||||||||||
| You are visitor 01402503 — GeezerVison does not store the pages you look up. Best viewed with Netscape Navigator 4.7 or Internet Explorer 6 at 800×600. No cookies required. |