Produce 3-D plots.
Many different combinations of arguments are possible. The simplest
form is
in which the arguments are taken to be the vertices of the points to
be plotted in three dimensions. If all arguments are vectors of the
same length, then a single continuous line is drawn. If all arguments
are matrices, then each column of is treated as a separate line. No attempt
is made to transpose the arguments to make the number of rows match.
If only two arguments are given, as
the real and imaginary parts of the second argument are used
as the y and z coordinates, respectively.
If only one argument is given, as
the real and imaginary parts of the argument are used as the y
and z values, and they are plotted versus their index.
Arguments may also be given in groups of three as
plot3 (x1, y1, z1, x2, y2, z2, …)
in which each set of three arguments is treated as a separate line or
set of lines in three dimensions.
To plot multiple one- or two-argument groups, separate each group
with an empty format string, as
plot3 (x1, c1, "", c2, "", …)
Multiple property-value pairs may be specified which will affect the line
objects drawn by plot3. If the fmt argument is supplied it
will format the line objects in the same manner as plot.
If the first argument hax is an axes handle, then plot into this axis,
rather than the current axes returned by gca.
The optional return value h is a graphics handle to the created plot.
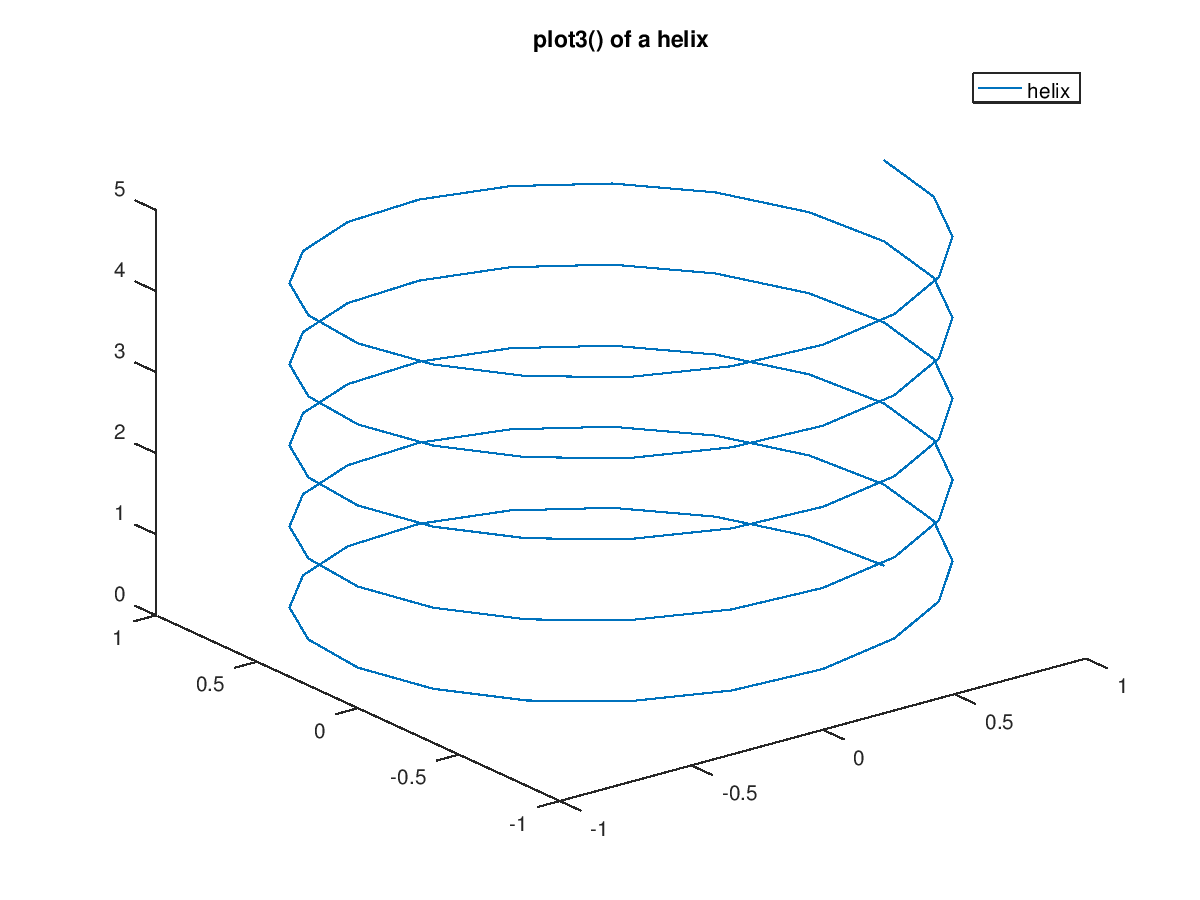
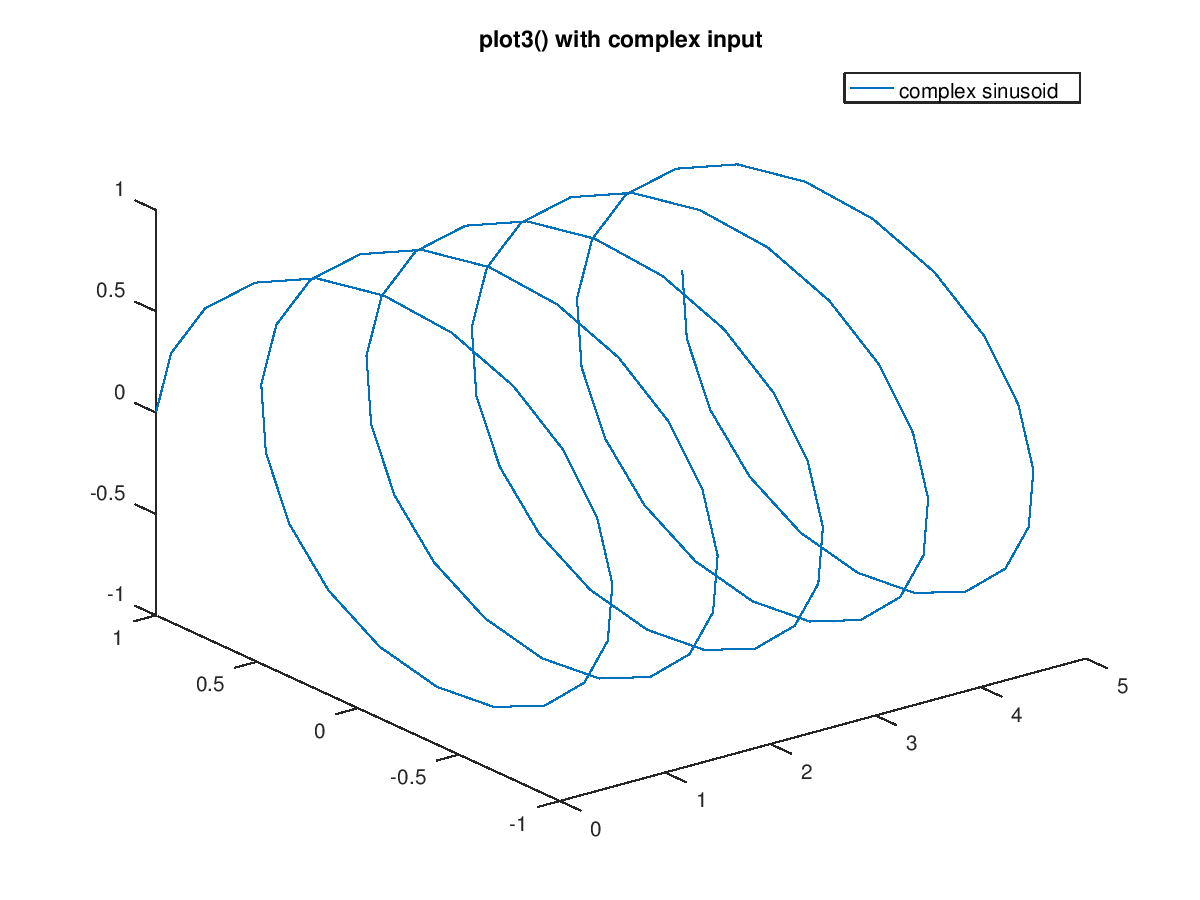
Example:
z = [0:0.05:5];
plot3 (cos (2*pi*z), sin (2*pi*z), z, ";helix;");
plot3 (z, exp (2i*pi*z), ";complex sinusoid;");
See also: ezplot3, plot.