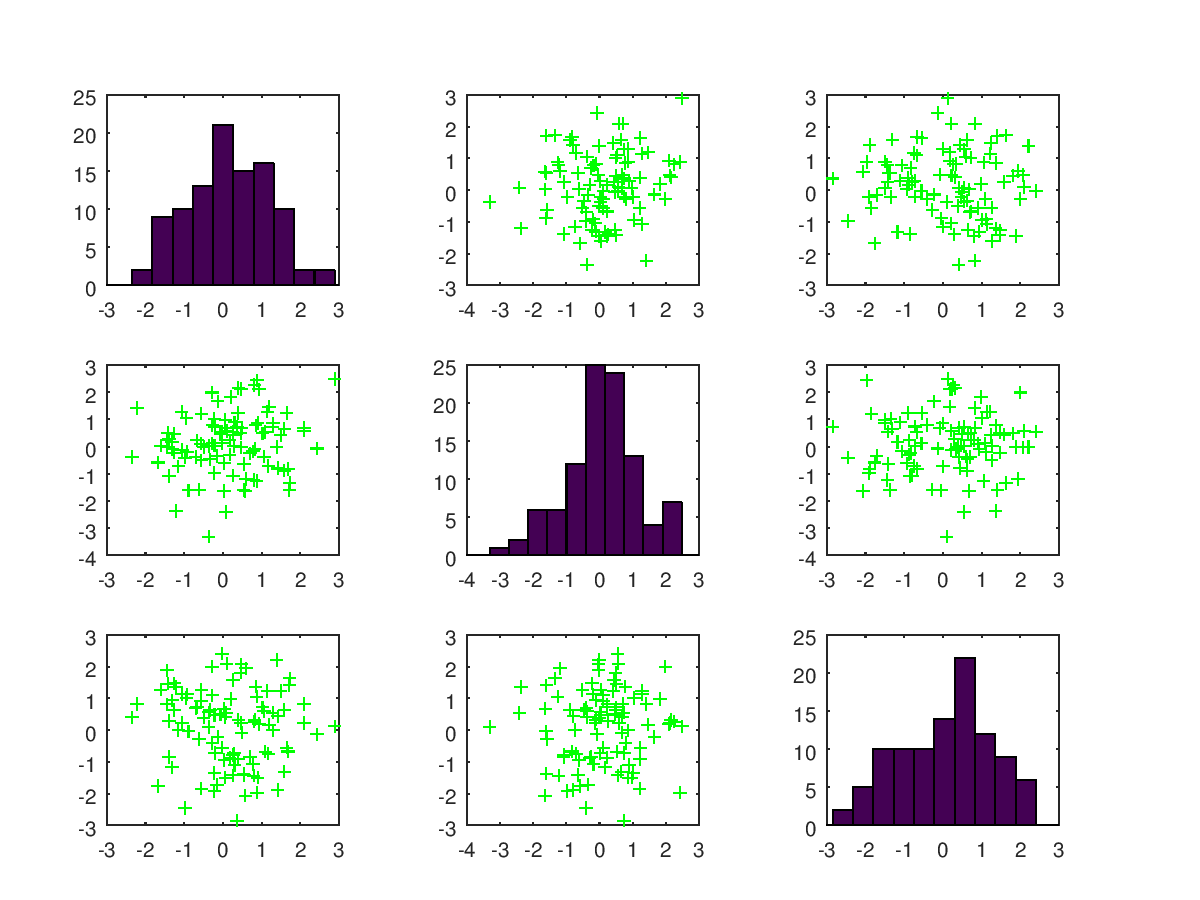
Scatter plot of the columns of one matrix against another.
Given the arguments x and y that have a matching number of
rows, plotmatrix plots a set of axes corresponding to
When called with a single argument x this is equivalent to
except that the diagonal of the set of axes will be replaced with the
histogram hist (x(:, i)).
The marker to use can be changed with the style argument, that is a
string defining a marker in the same manner as the plot command.
If the first argument hax is an axes handle, then plot into this axis,
rather than the current axes returned by gca.
The optional return value h provides handles to the individual
graphics objects in the scatter plots, whereas ax returns the
handles to the scatter plot axis objects.
bigax is a hidden axis object that surrounds the other axes, such
that the commands xlabel, title, etc., will be associated
with this hidden axis.
Finally, p returns the graphics objects associated with the histogram
and pax the corresponding axes objects.
Example:
plotmatrix (randn (100, 3), "g+")
See also: scatter, plot.