GeezerVisonThe World Wide Web, restored to 800 pixels of glory. | |||||||||||||||||||||||||||||||||||||||||||||||||||||||||||||||||||||||||||||||||
| Home|About|Gaming cabinet|Archives|How it works|Starter sites | |||||||||||||||||||||||||||||||||||||||||||||||||||||||||||||||||||||||||||||||||
GeezerVison is showing pbpython.com — Creating Interactive Dashboards from Jupyter Notebooks - Practical Business Python 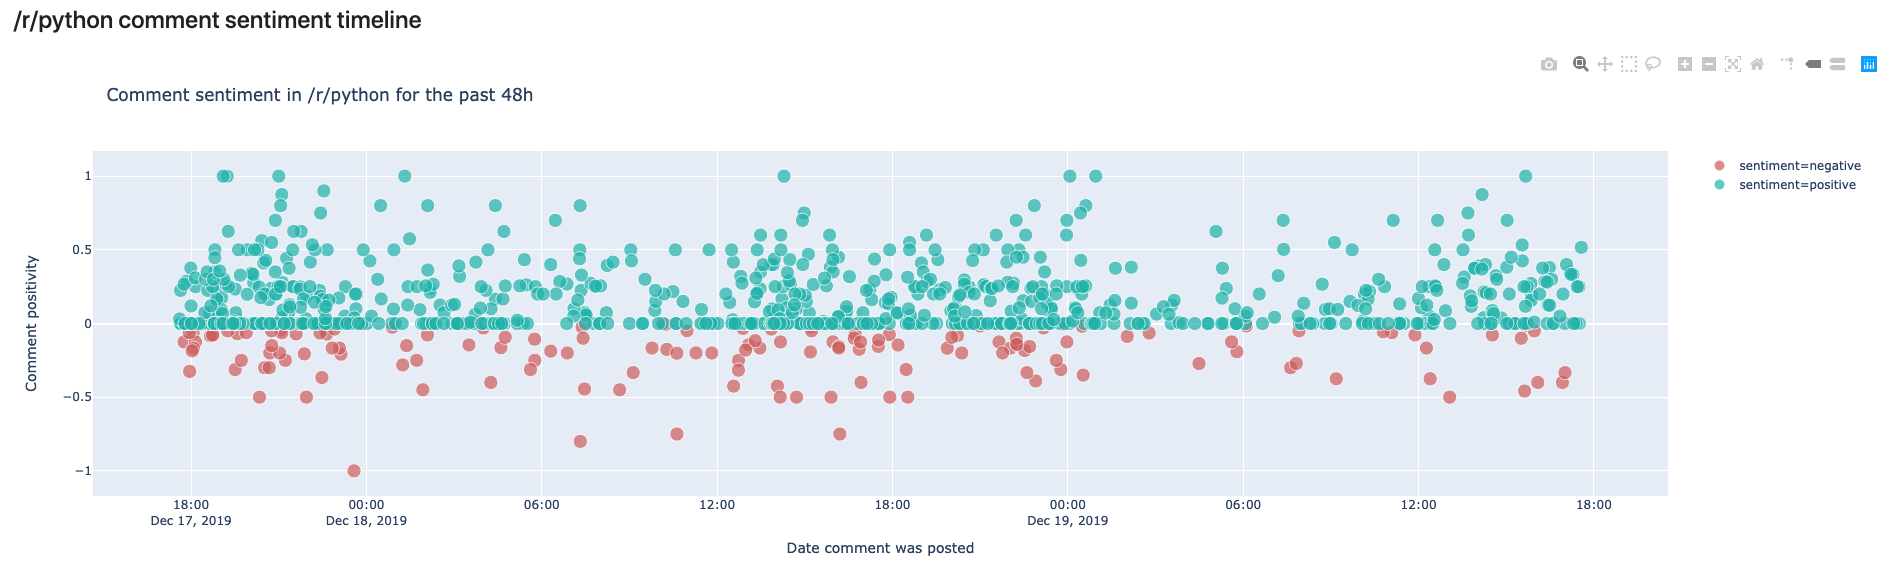
IntroductionI am pleased to have another guest post from Duarte O.Carmo. He wrote series of posts in July on report generation with Papermill that were very well received. In this article, he will explore how to use Voilà and Plotly Express to convert a Jupyter notebook into a standalone interactive web site. In addition, this article will show examples of collecting data through an API endpoint, performing sentiment analysis on that data and show multiple approaches to deploying the dashboard. About DuarteHey everyone! My name is Duarte O.Carmo and I’m a Consultant working
at Jabra that loves working with python and data. Make sure to visit my
website if you want to find more about me Since this is a long article, here are the table of contents for easier navigation: The GoalJupyter notebooks are one of my favorite tools to work with data, they are simple to use, fast to set up, and flexible. However, they do have their disadvantages: source control, collaboration, and reproducibility are just some of them. As I illustrated in my prior post, I tend to enjoy seeing what I can accomplish with them. An increasing need is the sharing of our notebooks. Sure, you can export your notebooks to html, pdf, or even use something like nbviewer to share them. But what if your data changes constantly? What if every time you run your notebook, you expect to see something different? How can you go about sharing something like that? But what if your data changes constantly? What if every time you run your notebook, you expect to see something different? How can you go about sharing something like that? In this article, I’ll show you how to create a Jupyter Notebook that fetches live data, builds an interactive plot and then how to deploy it as a live dashboard. When you want to share the dashboard, all you need to share with someone is a link. Let’s have some fun with the data first. Getting live Reddit dataWe will use Reddit as the source of data for our dashboard. Reddit is a tremendous source of information, and there are a million ways to get access to it. One of my favorite ways to access the data is through a small API called pushshift. The documentation is right here. Let’s say you wanted the most recent comments mentioning the word “python”. In python, you could use requests to get a json version of the data: import requests url = "https://api.pushshift.io/reddit/search/comment/?q=python" request = requests.get(url) json_response = request.json() You can add a multitude of parameters to this request, such as:
To make my life easier, I built a function that allows me to call this API as a function: def get_pushshift_data(data_type, **kwargs): """ Gets data from the pushshift api. data_type can be 'comment' or 'submission' The rest of the args are interpreted as payload. Read more: https://github.com/pushshift/api """ base_url = f"https://api.pushshift.io/reddit/search/{data_type}/" payload = kwargs request = requests.get(base_url, params=payload) return request.json() Using the get_pushshift_data(data_type="comment", # give me comments q="python", # that mention 'python' after="48h", # in the last 48 hours size=1000, # maximum 1000 comments sort_type="score", # sort them by score sort="desc") # sort descending returns the json response. Pretty sweet right? Analyzing the data with Plotly ExpressIn what subreddits does the word ‘python’ appear more?To answer the above question, we start by getting the data with our function: data = get_pushshift_data(data_type="comment", q="python", after="48h", size=1000, aggs="subreddit") The Since the json response is pretty nested, we’ll need to navigate a bit inside of the dictionary. data = data.get("aggs").get("subreddit") And we transform the list of dictionaries returned into a pandas DataFrame, and get the top 10. df = pandas.DataFrame.from_records(data)[0:10] Here’s what our DataFrame looks like:
These are the names of the subreddits where the word Let’s plot our results with the Ploty Express library. Plotly Express is great, in my opinion, if you want to:
Here’s all the code you need: import plotly.express as px px.bar(df, # our dataframe x="key", # x will be the 'key' column of the dataframe y="doc_count", # y will be the 'doc_count' column of the dataframe title=f"Subreddits with most activity - comments with 'python' in the last 48h", labels={"doc_count": "# comments","key": "Subreddits"}, # the axis names color_discrete_sequence=["blueviolet"], # the colors used height=500, width=800) Yes, perhaps a bit more verbose than matplotlib, but you get an interactive chart! 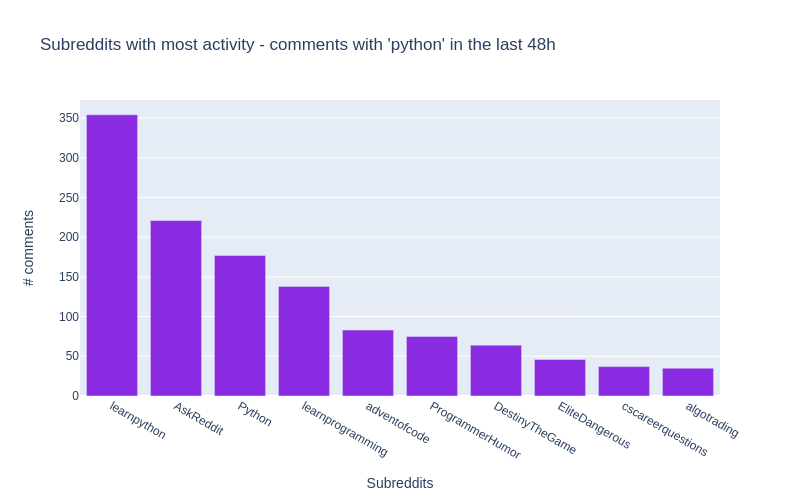
All of the details are included in the notebook for this article. What are the most up-voted comments with the word ‘python’?To answer this question, our function will again come in handy. Let’s aggregate things a bit. Don’t get scared, this is a one liner that will produce similar results to above: # get the data we need using the function data = get_pushshift_data(data_type="comment", q="python", after="7d", size=10, sort_type="score", sort="desc").get("data") # we only care about certain columns df = pandas.DataFrame.from_records(data)[["author", "subreddit", "score", "body", "permalink"]] # we only keep the first X characters of the body of the comment (sometimes they are too big) df['body'] = df['body'].str[0:400] + "..." # we append the string to all the permalink entries so that we have a link to the comment df['permalink'] = "https://reddit.com" + df['permalink'].astype(str) # style the last column to be clickable and print df.style.format({'permalink': make_clickable}) To make a DataFrame column clickable you can can apply the following function to it: def make_clickable(val): """ Makes a pandas column clickable by wrapping it in some html. """ return '<a href="{}">Link</a>'.format(val,val) The above code will return the top 10 most upvoted comments of the last 7 days:
In the notebook, you can click the link column to be taken right into the comment. Hooray! What is the sentiment in /r/python across time? Introducing TextBlobAlright, the final analysis is a bit more complicated. We want to see the sentiment in the /r/python subreddit in some sort of time line. First, we already now how to retrieve the most up voted comments of the past 2 days: # get the data with our function data = get_pushshift_data(data_type="comment", after="2d", size=1000, sort_type="score", sort="desc", subreddit="python").get("data") # define a list of columns we want to keep columns_of_interest = ["author", "body", "created_utc", "score", "permalink"] # transform the response into a dataframe df = pandas.DataFrame.from_records(data)[columns_of_interest] This gives us a pandas DataFrame with the columns specified in Enter TextBlob. A simple library that makes it ridiculously easy to get the sentiment of a sentence. Textblob returns two values, the sentiment polarity (-1 is negative; 0 is neutral; and 1 is positive) and the sentiment subjectivity (0 is objective and 1 is subjective) Here’s an example: import textblob sentence1 = "Portugal is a horrible country. People drive like crazy animals." print(textblob.TextBlob(sentence1).sentiment) # -> Sentiment(polarity=-0.8, subjectivity=0.95) # negative and subjective sentence2 = "Portugal is the most beautiful country in the world because beaches face west." print(textblob.TextBlob(sentence2).sentiment) # -> Sentiment(polarity=0.675, subjectivity=0.75) # positive and less subjective Read more about the library here. Now that we know how to extract sentiment from a piece of text, we can easily create some other columns for our DataFrame of comments: # create a column with sentiment polarity df["sentiment_polarity"] = df.apply(lambda row: textblob.TextBlob(row["body"]).sentiment.polarity, axis=1) # create a column with sentiment subjectivity df["sentiment_subjectivity"] = df.apply(lambda row: textblob.TextBlob(row["body"]).sentiment.subjectivity, axis=1) # create a column with 'positive' or 'negative' depending on sentiment_polarity df["sentiment"] = df.apply(lambda row: "positive" if row["sentiment_polarity"] >= 0 else "negative", axis=1) # create a column with a text preview that shows the first 50 characters df["preview"] = df["body"].str[0:50] # take the created_utc parameter and tranform it into a datetime column df["date"] = pandas.to_datetime(df['created_utc'],unit='s') Finally, it’s time to plot our figure with the help of Plotly Express: px.scatter(df, x="date", # date on the x axis y="sentiment_polarity", # sentiment on the y axis hover_data=["author", "permalink", "preview"], # data to show on hover color_discrete_sequence=["lightseagreen", "indianred"], # colors to use color="sentiment", # what should the color depend on? size="score", # the more votes, the bigger the circle size_max=10, # not too big labels={"sentiment_polarity": "Comment positivity", "date": "Date comment was posted"}, # axis names title=f"Comment sentiment in /r/python for the past 48h", # title of figure ) And here’s the output!
In this view, we can see the comments made in /r/python in the last 48 hours. We can see that most comments are rather on the positive side, but some are also negative. In your own notebook you’ll notice that you can hover over the comments and read the preview to see why they were classified as negative or positive. The cool thing here is that if you run the same script tomorrow, you’ll get a different output. So how can we have this in some place that “automatically” is updated whenever we see it? Creating a live dashboard with VoilàVoilà has a simple premise: “Voilà turns Jupyter notebooks into standalone web applications.” Let’s back up a bit, and get everything you need running in your system. First step is to have a working setup with everything above, for that, follow these instructions . Once that is done, you should be able to launch the dashboard with: (env) $ voila notebooks/Dashboard.ipynb Now, you should be able to see a web like application in a new tab in your browser from the notebook we created! Feel free to modify this notebook according to your interests. You’ll notice that I have created some general variables in the first notebook cell, so you can fire up Jupyter Lab, and modify them and see what comes out! Here are the general modifiable cells: COMMENT_COLOR = "blueviolet" # color for your comment graph SUBMISSION_COLOR = "darkorange" # color for your submission graph TEXT_PREVIEW_SIZE = 240 # how long should the preview be? TERM_OF_INTEREST = "python" # maybe you are interested in some other term? SUBREDDIT_OF_INTEREST = "python" # maybe you are interested in some other subreddit? TIMEFRAME = "48h" # you can define another timeline Once you have modified your dashboard, you can launch Voilà again to see the results. The most important thing about Voilà is that every time it runs, it actually re-runs your whole code, which yes, makes things a bit slow, but also means that the results get updated every time the page is refreshed! :tada: Deploying your notebook to the webFirst option: Using binderBinder helps you turn a simple GitHub repo into an interactive notebook environment. They do this by using docker images to reproduce your GitHub repo’s setup. We don’t really care about all that. We just want to publish our Voilà dashboard. To do that, follow these steps:
Here is the running example of our reddit dashboard. (Takes a bit to build for the first time..) Second Option: Using an ubuntu server in a hacky way with tmux
| |||||||||||||||||||||||||||||||||||||||||||||||||||||||||||||||||||||||||||||||||
| You are visitor 01402503 — GeezerVison does not store the pages you look up. Best viewed with Netscape Navigator 4.7 or Internet Explorer 6 at 800×600. No cookies required. |


