GeezerVisonThe World Wide Web, restored to 800 pixels of glory. | |||||||||||||||||||||||||||||||||||||||||||||||||||||||||||||||||||||||||||||||||||||||||||||||||||||||
| Home|About|Gaming cabinet|Archives|How it works|Starter sites | |||||||||||||||||||||||||||||||||||||||||||||||||||||||||||||||||||||||||||||||||||||||||||||||||||||||
GeezerVison is showing pbpython.com — Creating PDF Reports with Pandas, Jinja and WeasyPrint - Practical Business Python IntroductionPandas is excellent at manipulating large amounts of data and summarizing it in multiple text and visual representations. Without much effort, pandas supports output to CSV, Excel, HTML, json and more. Where things get more difficult is if you want to combine multiple pieces of data into one document. For example, if you want to put two DataFrames on one Excel sheet, you need to use the Excel libraries to manually construct your output. It is certainly possible but not simple. This article will describe one method to combine multiple pieces of information into an HTML template and then converting it to a standalone PDF document using Jinja templates and WeasyPrint. Before going too far through this article, I would recommend that you review the previous articles on Pandas Pivot Tables and the follow-on article on generating Excel reports from these tables. They explain the data set I am using and how to work with pivot tables. The ProcessAs shown in the reporting article, it is very convenient to use Pandas to output data into multiple sheets in an Excel file or create multiple Excel files from pandas DataFrames. However, if you would like to combine multiple pieces of information into a single file, there are not many simple ways to do it straight from Pandas. Fortunately, the python environment has many options to help us out. In this article, I’m going to use the following process flow to create a multi-page PDF document. 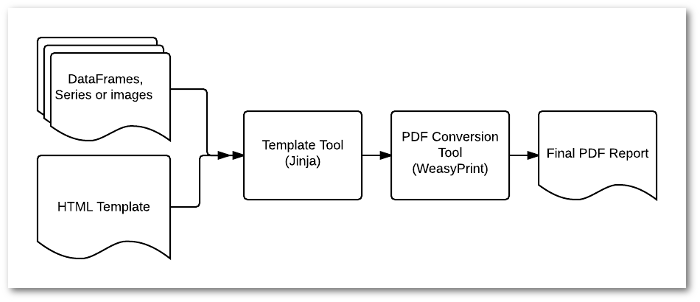
The nice thing about this approach is that you can substitute your own tools into this workflow. Don’t like Jinja? Plug in mako or your templating tool of choice. If you want to use another type of markup outside of HTML, go for it. The ToolsFirst, I decided to use HTML as the templating language because it is probably the simplest way to generate structured data and allow for relatively rich formatting. I also think everyone knows (or can figure out) enough HTML to generate a simple report. Also, I don’t have the desire to learn a whole new templating language. However, if you choose to use other markup languages, the flow should work the same. I chose Jinja because I have experience with Django and it closely mirrors Django’s syntax. There are certainly other options out there so feel free to experiment with your options. I think for this approach there is nothing very complicated about our templates so any tool should work fine. Finally, the most difficult part of this tool chain is figuring out how to render the HTML into PDF. I don’t feel like there is an optimal solution yet but I chose WeasyPrint because it is still being actively maintained and I found that I could get it working relatively easily. There are quite a few dependencies for it to work so I’ll be curious if people have any real challenges getting it to work on Windows. As an alternative, I have used xhtml2pdf in the past and it works well too. Unfortunately the documentation is a little lacking at this time but it has been around for a while and does generate PDF’s effectively from HTML. The DataAs discussed above, we’ll use the same data from my previous articles. In order to keep this all a self-contained article, here is how I import the data and generate a pivot table as well as some summary statistics of the average quantity and price of the CPU and Software sales. Import modules, and read in the sales funnel information. from __future__ import print_function import pandas as pd import numpy as np df = pd.read_excel("sales-funnel.xlsx") df.head()
Pivot the data to summarize. sales_report = pd.pivot_table(df, index=["Manager", "Rep", "Product"], values=["Price", "Quantity"], aggfunc=[np.sum, np.mean], fill_value=0) sales_report.head()
Generate some overall descriptive statistics about the entire data set. In this case, we want to show the average quantity and price for CPU and Software sales. print(df[df["Product"]=="CPU"]["Quantity"].mean()) print(df[df["Product"]=="CPU"]["Price"].mean()) print(df[df["Product"]=="Software"]["Quantity"].mean()) print(df[df["Product"]=="Software"]["Price"].mean()) 1.88888888889 51666.6666667 1.0 10000.0 Ideally what we would like to do now is to split our data up by manager and include some of the summary statistics on a page to help understand how the individual results compare to the national averages. DataFrame OptionsI have one quick aside before we talk templates. For some quick and dirty needs,
sometimes all you need to do is copy and paste the data. Fortunately
a DataFrame has a The other option we will use later in the template is the TemplatingJinja templating is very powerful and supports a lot of advanced features such as sandboxed execution and auto-escaping that are not necessary for this application. These capabilities however will serve you well as your reports grow more complex or you choose to use Jinja for your web apps. The other nice feature of Jinja is that it includes multiple builtin filters which will allow us to format some of our data in a way that is difficult to do within Pandas. In order to use Jinja in our application, we need to do 3 things:
Here is a very simple template, let’s call it myreport.html : <!DOCTYPE html> <html> <head lang="en"> <meta charset="UTF-8"> <title>{{ title }}</title> </head> <body> <h2>Sales Funnel Report - National</h2> {{ national_pivot_table }} </body> </html> The two keys portions of this code are the To populate those variable, we need to create a Jinja environment and get our template: from jinja2 import Environment, FileSystemLoader env = Environment(loader=FileSystemLoader('.')) template = env.get_template("myreport.html") In the example above, I am assuming that the template is in the current directory but you could put the full path to a template location. The other key component is the creation of Note how the names of the variables match our templates. template_vars = {"title" : "Sales Funnel Report - National", "national_pivot_table": sales_report.to_html()} The final step is to render the HTML with the variables included in the output. This will create a string that we will eventually pass to our PDF creation engine. html_out = template.render(template_vars) For the sake of brevity, I won’t show the full HTML but you should get the idea. Generate PDFThe PDF creation portion is relatively simple as well. We need to do some imports and pass a string to the PDF generator. from weasyprint import HTML HTML(string=html_out).write_pdf("report.pdf") This command creates a PDF report that looks something like this: 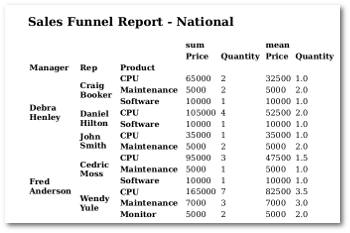
Ugh. It’s cool that it’s a PDF but it is ugly. The main problem is that we don’t have any styling on it. The mechanism we have to use to style is CSS. As an aside, I really don’t like CSS. Every time I start playing with it I feel like I spend more time monkeying with the presentation than I did getting the data summarized. I am open to ideas on how to make this look nicer but in the end, I decided to go the route of using a portion of blueprint CSS to have very simple styling that would work with the rendering engines. For the rest of the article, I’ll be using blue print’s typography.css as the basis for my style.css shown below. What I like about this css is:
Let’s try re-rendering it with our updated stylesheet: HTML(string=html_out).write_pdf(args.outfile.name, stylesheets=["style.css"]) 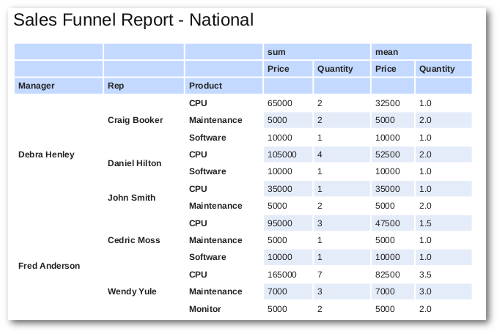
Just adding a simple stylesheet makes a huge difference! There is still a lot more you can do with it but this shows how to make it at least serviceable for a start. As an aside, I think it would be pretty cool if someone that knew CSS way better than me developed an open sourced, simple CSS sheet we could use for report generation like this. More Complex TemplatingUp until now, we haven’t done anything different than if we had just generated
a simple Excel sheet using In order to generate a more useful report, we are going to combine the summary statistics shown above as well as break out the report to include a separate PDF page per manager. Let’s start with the updated template (myreport.html): <!DOCTYPE html> <html> <head lang="en"> <meta charset="UTF-8"> <title>{{ title }} </title> </head> <body> <div class="container"> <h2>Sales Funnel Report - National</h2> {{ national_pivot_table }} {% include "summary.html" %} </div> <div class="container"> {% for manager in Manager_Detail %} <p style="page-break-before: always" ></p> <h2>Sales Funnel Report - {{manager.0}}</h2> {{manager.1}} {% include "summary.html" %} {% endfor %} </div> </body> </html> The first thing you’ll notice is that there is an Here is what summary.html looks like: <h3>National Summary: CPUs</h3> <ul> <li>Average Quantity: {{CPU.0|round(1)}}</li> <li>Average Price: {{CPU.1|round(1)}}</li> </ul> <h3>National Summary: Software</h3> <ul> <li>Average Quantity: {{Software.0|round(1)}}</li> <li>Average Price: {{Software.1|round(1)}}</li> </ul> In this snippet, you’ll see that there are some additional variables
we have access to: You may also notice that we use a pipe There is also a for loop that allows us to display the details for each manager in our report. Jinja’s template language only includes a very small subset of code that alters the control flow. Basic for-loops are a mainstay of almost any template so they should make sense to most of you. I want to call out one final piece of code that looks a little out of place: <p style="page-break-before: always" ></p> This is a simple CSS directive that I put in to make sure the CSS breaks on each page. I had to do a little digging to figure out the best way to make the pages break so I thought I would include it to help others out. Additional StatsNow that we have gone through the templates, here is how to create the additional context variables used in the templates. Here is a simple summary function: def get_summary_stats(df,product): """ For certain products we want National Summary level information on the reports Return a list of the average quantity and price """ results = [] results.append(df[df["Product"]==product]["Quantity"].mean()) results.append(df[df["Product"]==product]["Price"].mean()) return results We also need to create the manager details: manager_df = [] for manager in sales_report.index.get_level_values(0).unique(): manager_df.append([manager, sales_report.xs(manager, level=0).to_html()]) Finally, call the template with these variables: template_vars = {"title" : "National Sales Funnel Report", "CPU" : get_summary_stats(df, "CPU"), "Software": get_summary_stats(df, "Software"), "national_pivot_table": sales_report.to_html(), "Manager_Detail": manager_df} # Render our file and create the PDF using our css style file html_out = template.render(template_vars) HTML(string=html_out).write_pdf("report.pdf",stylesheets=["style.css"]) Here is the final PDF Report . I think it looks pretty decent for a simple report. Ideas For ImprovementsIn the example above, we used the simple There are a couple of options:
Final ProgramIn order to pull it all together, here is the full program: """ Generate PDF reports from data included in several Pandas DataFrames From pbpython.com """ from __future__ import print_function import pandas as pd import numpy as np import argparse from jinja2 import Environment, FileSystemLoader from weasyprint import HTML def create_pivot(df, infile, index_list=["Manager", "Rep", "Product"], value_list=["Price", "Quantity"]): """ Create a pivot table from a raw DataFrame and return it as a DataFrame """ table = pd.pivot_table(df, index=index_list, values=value_list, aggfunc=[np.sum, np.mean], fill_value=0) return table def get_summary_stats(df,product): """ For certain products we want National Summary level information on the reports Return a list of the average quantity and price """ results = [] results.append(df[df["Product"]==product]["Quantity"].mean()) results.append(df[df["Product"]==product]["Price"].mean()) return results if __name__ == "__main__": parser = argparse.ArgumentParser(description='Generate PDF report') parser.add_argument('infile', type=argparse.FileType('r'), help="report source file in Excel") parser.add_argument('outfile', type=argparse.FileType('w'), help="output file in PDF") args = parser.parse_args() # Read in the file and get our pivot table summary df = pd.read_excel(args.infile.name) sales_report = create_pivot(df, args.infile.name) # Get some national summary to include as well manager_df = [] for manager in sales_report.index.get_level_values(0).unique(): manager_df.append([manager, sales_report.xs(manager, level=0).to_html()]) # Do our templating now # We can specify any directory for the loader but for this example, use current directory env = Environment(loader=FileSystemLoader('.')) template = env.get_template("myreport.html") template_vars = {"title" : "National Sales Funnel Report", "CPU" : get_summary_stats(df, "CPU"), "Software": get_summary_stats(df, "Software"), "national_pivot_table": sales_report.to_html(), "Manager_Detail": manager_df} # Render our file and create the PDF using our css style file html_out = template.render(template_vars) HTML(string=html_out).write_pdf(args.outfile.name,stylesheets=["style.css"]) You can also view the gist if you are interested amd download a zip file of myreport.html, style.css and summary.html if you find it helpful. Thanks for reading all the way to the end. As always, feedback is appreciated. Comments | |||||||||||||||||||||||||||||||||||||||||||||||||||||||||||||||||||||||||||||||||||||||||||||||||||||||
| You are visitor 01402503 — GeezerVison does not store the pages you look up. Best viewed with Netscape Navigator 4.7 or Internet Explorer 6 at 800×600. No cookies required. | |||||||||||||||||||||||||||||||||||||||||||||||||||||||||||||||||||||||||||||||||||||||||||||||||||||||