GeezerVisonThe World Wide Web, restored to 800 pixels of glory. |
| Home|About|Gaming cabinet|Archives|How it works|Starter sites |
GeezerVison is showing pbpython.com — sidetable - Create Simple Summary Tables in Pandas - Practical Business Python 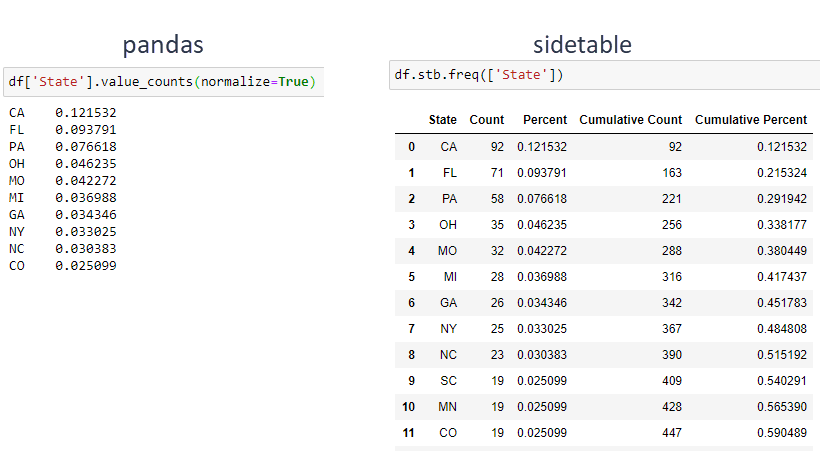
IntroductionToday I am happy to announce the release of a new pandas utility library called sidetable. This library makes it easy to build a frequency table and simple summary of missing values in a DataFrame. I have found it to be a useful tool when starting data exploration on a new data set and I hope others find it useful as well. This project is also an opportunity to illustrate how to use pandas new API to register custom DataFrame accessors. This API allows you to build custom functions for working with pandas DataFrames and Series and could be really useful for building out your own library of custom pandas accessor functions. sidetableAt its core, sidetable is a super-charged version of pandas The only external dependency is pandas version >= 1.0. Make sure it is installed, then install sidetable: python -m pip install sidetable Once sidetable is installed, you need to import it to get the pandas accessor registered. import pandas as pd import sidetable df = pd.read_csv('https://github.com/chris1610/pbpython/blob/master/data/school_transform.csv?raw=True', index_col=0) 
Now that sidetable is imported, you have a new accessor on all your DataFrames - df.stb.freq(['State']) 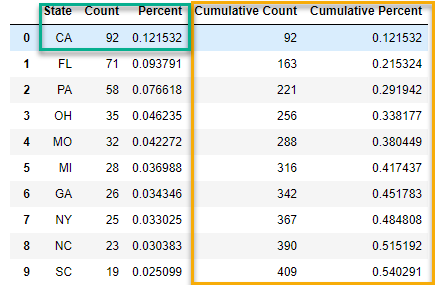
This example shows that CA occurs 92 times and represents 12.15% of the total number of schools. If you include FL in the counts, you now have 163 total schools that represent 21.5% of the total. As of version 0.6, sidetable displays percents correctly. The examples shown here are proportions not percentages. Newer versions will multiply the results times 100 - which is the correct way to represent a percent. Recent versions of sidetable also use lower cases titles for column names. Users are encouraged to use the most recent version. For comparison, here’s 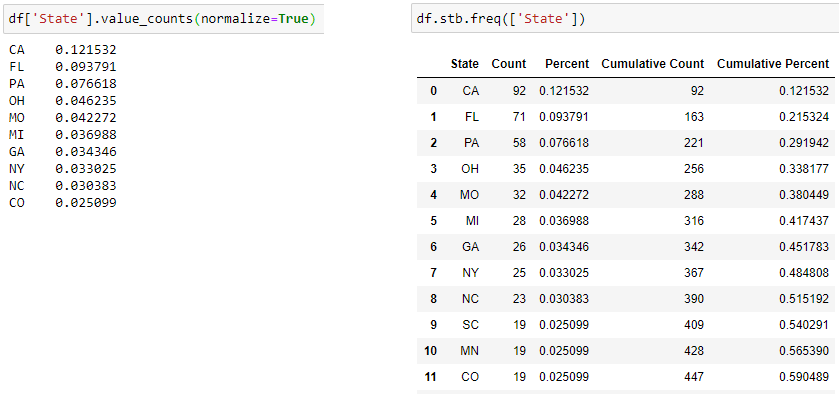
I think you’ll agree sidetable provides a lot more insight with not much more effort. But wait, there’s more! What if we want a quick view of the states that contribute around 50% of the total? Use the
df.stb.freq(['State'], thresh=.5) 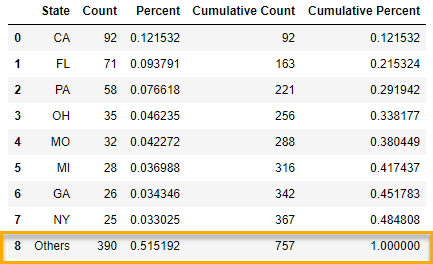
This is handy. Now we can see that 8 states contributed almost 50% of the total and all the other states account for the remainder. If we want, we can rename the catch-all category using df.stb.freq(['State'], thresh=.5, other_label='Rest of states') One of the useful features of sidetable is that it can group columns together to further understand the distribution. For instance, what if we want to see how the various “Transformation Models” are applied across Regions? df.stb.freq(['Region', 'Model Selected']) 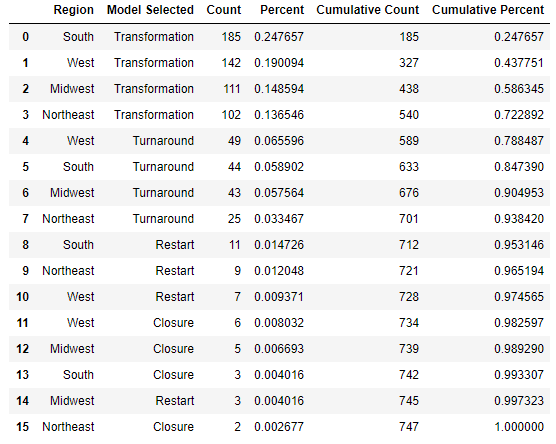
This view is a quick way to understand the interaction and distribution of the various data elements. I find that this is an easy way to explore data and get some insights that might warrant further analysis. A table like this is also easy to share with others since it is relatively simple to understand. You could definitely perform this analysis with standard pandas (that’s all that is behind the scenes after all). It is cumbersome though, to remember the code. My experience is that if it is tough to remember then you are less likely to do it. simpletable tries to make this type of summary very easy to do. Up until now, we have been counting the number of instances. What might be much more
interesting is looking at the total breakdown by df.stb.freq(['Region'], value='Award_Amount') 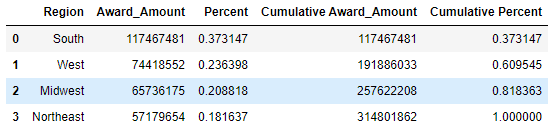
This view gives us insight that the Northeast has the least amount of dollars spent on these projects and that 37% of the total spend went to schools in the South region. Finally, we can look at the types of models selected and determine the 80/20 breakdown of the allocated dollars: df.stb.freq(['Region', 'Model Selected'], value='Award_Amount', thresh=.82, other_label='Remaining') 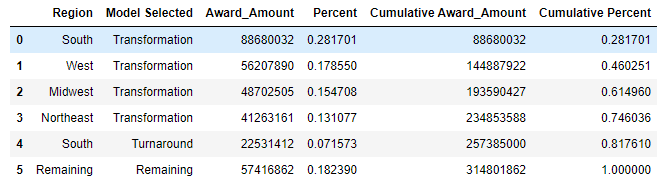
If you’re familiar with pandas crosstab, then one way to look at sidetable is that
it is an expanded version of a 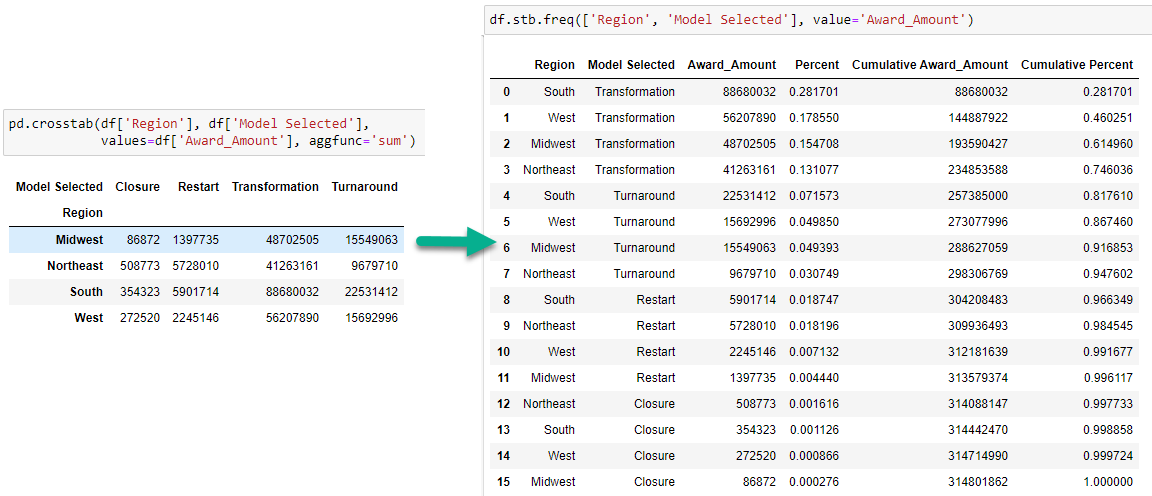
One of sidetable’s goals is that its output is easy to interpret. If you would like to leverage
pandas style functions to format your output for improved readability, sidetable can
format Percentage and Amount columns to be more readable. This is not used by
default but can be seen by passing df.stb.freq(['Region'], value='Award_Amount', style=True) 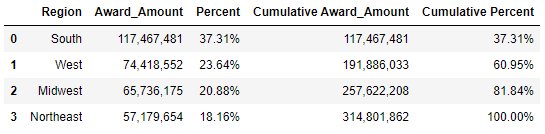
So far I have only shown the df.stb.missing() 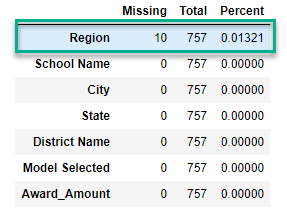
In this table, there are 10 missing values in the Region column that represent a little less than 1.3% of the total values in that column. You can get similar information using 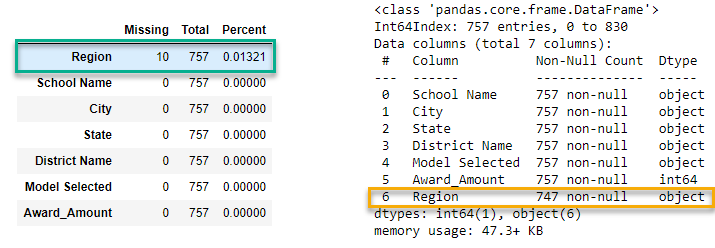
The documentation shows more information on usage and other options. Please check it out and let me know if it is useful to you. One thing I do want to do is thank three people for their contributions to make sidetable work.
Each of these references was leveraged very heavily to make sidetable. Thank you! Finally, the functionality in Introducing the pandas accessor APIIf you would like to learn how to build your own accessor, it’s actually relatively straightforward. As a reference, you can view the file that does all the work here. Here’s a short summary of how to get started. At the top of your file import pandas to get access to the decorator: import pandas as pd @pd.api.extensions.register_dataframe_accessor("stb") class SideTableAccessor: def __init__(self, pandas_obj): self._validate(pandas_obj) self._obj = pandas_obj This portion of code creates the accessor class and defines the accessor value which I have
chosen as When the class is instantiated, the current pandas DataFrame will be validated through the
In this case, I don’t really do much with the validate method but you could choose to add more logic: @staticmethod def _validate(obj): # verify this is a DataFrame if not isinstance(obj, pd.DataFrame): raise AttributeError("Must be a pandas DataFrame") All of the work is done in the For example, here is the full version of the def missing(self, clip_0=False, style=False): """ Build table of missing data in each column. clip_0 (bool): In cases where 0 counts are generated, remove them from the list style (bool): Apply a pandas style to format percentages Returns: DataFrame with each Column including total Missing Values, Percent Missing and Total rows """ missing = pd.concat([self._obj.isna().sum(), self._obj.isna().mean()], axis='columns').rename(columns={ 0: 'Missing', 1: 'Percent' }) missing['Total'] = len(self._obj) if clip_0: missing = missing[missing['Missing'] > 0] results = missing[['Missing', 'Total', 'Percent']].sort_values(by=['Missing'], ascending=False) if style: format_dict = {'Percent': '{:.2%}', 'Total': '{0:,.0f}'} return results.style.format(format_dict) else: return results In your “normal” pandas code, you would reference the DataFrame using I can see this as a very useful approach for building your own custom flavor of pandas functions. If you have certain transformation, cleaning or summarizing data that you do, then this might be an approach to consider - instead of just copying and pasting the code from file to file. SummaryPandas has a very rich API but sometimes it can take a lot of typing and wrangling to get the data in the format that is easy to understand. sidetable can make some of those summary tasks a lot easier by building frequency tables on combinations of your data and identifying gaps in your data. sidetable does not replace any of the sophisticated analysis you will likely need to do to answer complex questions. However, it is a handy tool for quickly analyzing your data and identifying patterns you may want to investigate further. In addition, I want sidetable to serve as an example of how to build you own pandas accessor that streamlines your normal analysis process. I hope you find sidetable useful. If you have ideas for improvements or bug reports, head on over to github and let me know. I hope this can grow over time and become a useful tool that helps many others. I am curious to see what the community does with it.
Tags
pandas
Comments |
| You are visitor 01402503 — GeezerVison does not store the pages you look up. Best viewed with Netscape Navigator 4.7 or Internet Explorer 6 at 800×600. No cookies required. |