GV

GeezerVison

The World Wide Web, restored to 800 pixels of glory.

Home|About|Gaming cabinet|Archives|How it works|Starter sites

On this site

  • Python (v7.1.0)
  • R
  • Julia
  • Javascript (v4.1.1)
  • ggplot2
  • MATLAB
  • F#
  • Download Studio
  • Studio and Cloud Pricing
  • Dash Enterprise Pricing
  • Getting Started
  • Is Plotly Free?
  • Figure Reference
  • API Reference

This view

  • Original page
  • New address

GeezerVison is showing plotly.com — Open Source Python Graphing & Data Visualization Library | Plotly

Quick Reference
Examples
View open positions at Plotly.

Explore step-by-step tutorials and code examples for figure structures, updating figures, displaying figures, and framework integrations to master our Python graphing library.

  • The Figure Data Structure
    View Tutorial The Figure Data Structure
  • Creating and Updating Figures
    View Tutorial Creating and Updating Figures
  • Displaying Figures
    View Tutorial Displaying Figures
  • Plotly Express
    View Tutorial Plotly Express
  • Analytical Apps with Dash
    View Tutorial Analytical Apps with Dash

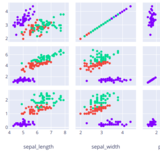
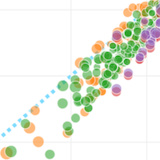
Find copy-pasteable code snippets and interactive demos to create standard Python charts, including scatter plots, line graphs, bar charts, pie charts, and bubble charts.

  • Scatter Plots
    View Tutorial Scatter Plots
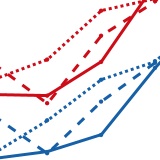
  • Line Charts
    View Tutorial Line Charts
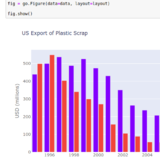
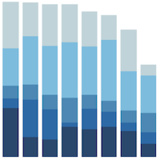
  • Bar Charts
    View Tutorial Bar Charts
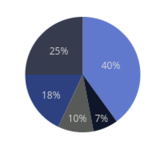
  • Pie Charts
    View Tutorial Pie Charts
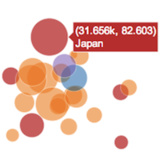
  • Bubble Charts
    View Tutorial Bubble Charts

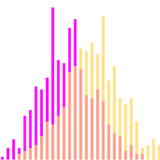
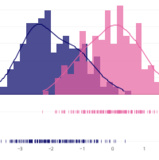
Browse code tutorials and live previews for complex data analysis, featuring box plots, histograms, error bars, and 2D density plots.

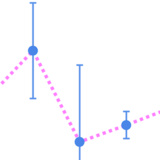
  • Error Bars
    View Tutorial Error Bars
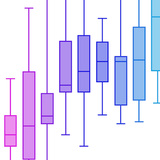
  • Box Plots
    View Tutorial Box Plots
  • Histograms
    View Tutorial Histograms
  • Distplots
    View Tutorial Distplots
  • 2D Histograms
    View Tutorial 2D Histograms

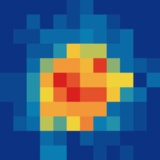
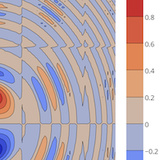
Access interactive examples and code snippets for domain-specific visualizations. Build heatmaps, contour plots, ternary plots, and log plots.

  • Contour Plots
    View Tutorial Contour Plots
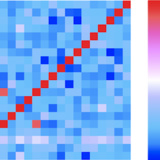
  • Heatmaps
    View Tutorial Heatmaps
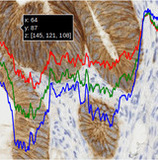
  • Imshow
    View Tutorial Imshow
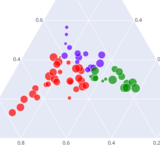
  • Ternary Plots
    View Tutorial Ternary Plots
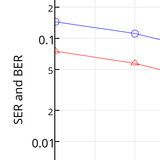
  • Log Plots
    View Tutorial Log Plots

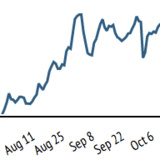
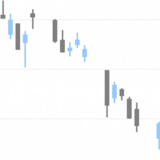
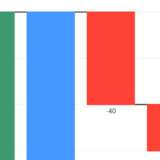
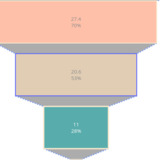
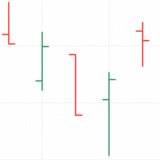
Explore code guides and live examples for financial data, including candlestick charts, OHLC plots, waterfall diagrams, funnel charts, and time series lines to create interactive graphs in Python.

  • Time Series and Date Axes
    View Tutorial Time Series and Date Axes
  • Candlestick Charts
    View Tutorial Candlestick Charts
  • Waterfall Charts
    View Tutorial Waterfall Charts
  • Funnel Chart
    View Tutorial Funnel Chart
  • OHLC Charts
    View Tutorial OHLC Charts

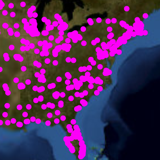
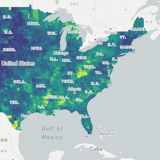
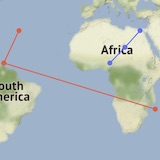
Learn how to build interactive geographic visualizations with step-by-step code snippets for Mapbox integration, tile choropleth maps, lines on maps, and bubble maps.

  • MapLibre Migration
    View Tutorial MapLibre Migration
  • Tile Choropleth Maps
    View Tutorial Tile Choropleth Maps
  • Lines on Tile Maps
    View Tutorial Lines on Tile Maps
  • Filled Area on Tile Maps
    View Tutorial Filled Area on Tile Maps
  • Bubble Maps
    View Tutorial Bubble Maps

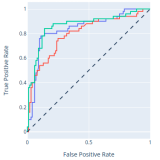
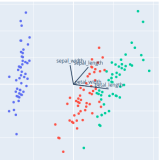
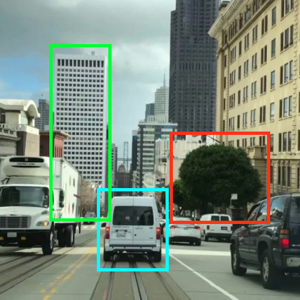
Visualize machine learning models with tutorials for ML regression, kNN classification, ROC and PR curves, and PCA visualization.

  • ML Regression
    View Tutorial ML Regression
  • kNN Classification
    View Tutorial kNN Classification
  • ROC and PR Curves
    View Tutorial ROC and PR Curves
  • PCA Visualization
    View Tutorial PCA Visualization
  • AI/ML Apps with Dash
    View Tutorial AI/ML Apps with Dash

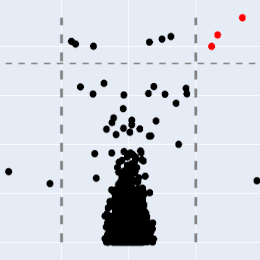
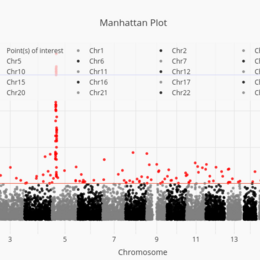
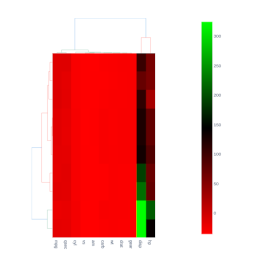
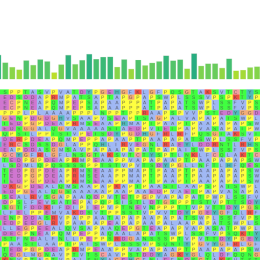
Access specialized charts for computational biology, including volcano plots, Manhattan plots, clustergrams, and alignment charts.

  • Volcano Plot
    View Tutorial Volcano Plot
  • Manhattan Plot
    View Tutorial Manhattan Plot
  • Clustergram
    View Tutorial Clustergram
  • Alignment Chart
    View Tutorial Alignment Chart
More Bioinformatics »

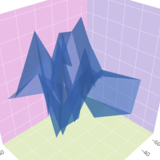
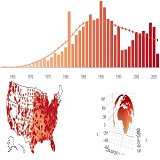
View high-performance code examples for 3D axes, 3D scatter plots, 3D surface plots, and 3D subplots to enhance your Python graphs.

  • 3D Axes
    View Tutorial 3D Axes
  • 3D Scatter Plots
    View Tutorial 3D Scatter Plots
  • 3D Surface Plots
    View Tutorial 3D Surface Plots
  • 3D Subplots
    View Tutorial 3D Subplots
  • 3D Camera Controls
    View Tutorial 3D Camera Controls

Find layout tutorials and code examples for combining multi-chart arrangements, map subplots, table subplots, and mixed layouts when plotting graphs in Python.

  • Mixed Subplots
    View Tutorial Mixed Subplots
  • Map Subplots
    View Tutorial Map Subplots
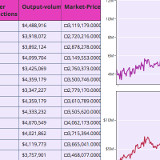
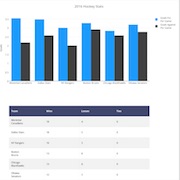
  • Table and Chart Subplots
    View Tutorial Table and Chart Subplots
  • Figure Factory Subplots
    View Tutorial Figure Factory Subplots

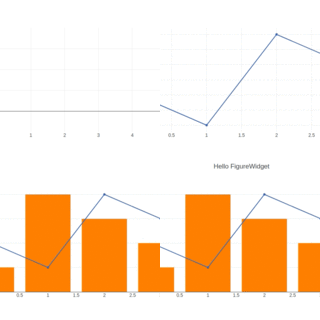
Learn how to connect your Python graph to interactive Jupyter environments using FigureWidget tutorials, interactive data analysis, and custom click events.

  • Plotly FigureWidget Overview
    View Tutorial Plotly FigureWidget Overview
  • Jupyter Lab with FigureWidget
    View Tutorial Jupyter Lab with FigureWidget
  • Interactive Data Analysis with FigureWidget ipywidgets
    View Tutorial Interactive Data Analysis with FigureWidget ipywidgets
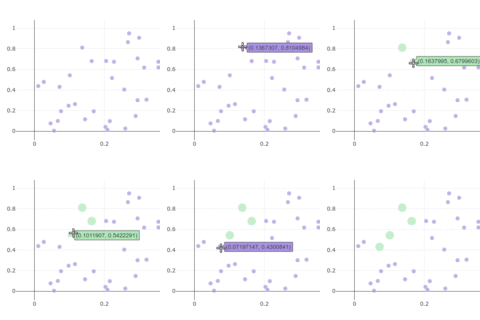
  • Click Events
    View Tutorial Click Events

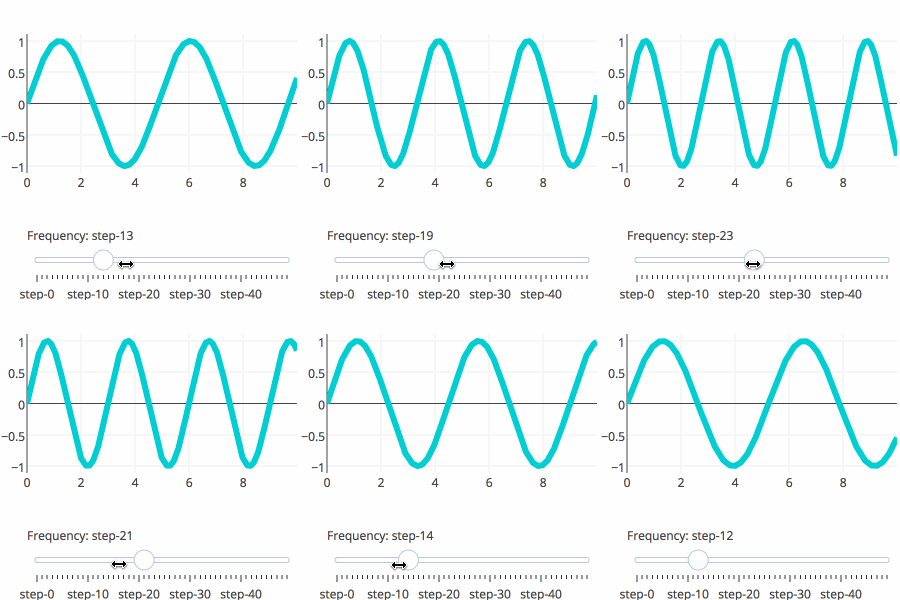
Discover code snippets and tutorials for building interactive UI controls directly into your visualizations, including dropdown menus, custom buttons, sliders, and range selectors to upgrade your graph in Python.

  • Custom Buttons
    View Tutorial Custom Buttons
  • Sliders
    View Tutorial Sliders
  • Dropdown Menus
    View Tutorial Dropdown Menus
  • Range Slider and Selector
    View Tutorial Range Slider and Selector

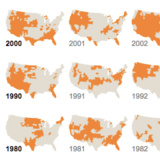
Explore code tutorials and interactive demos for animating data points, building time-series sliders, and creating smooth transitions to build a dynamic Python graph.

  • Intro to Animations
    View Tutorial Intro to Animations

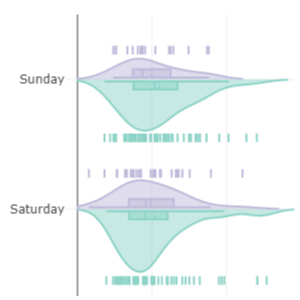
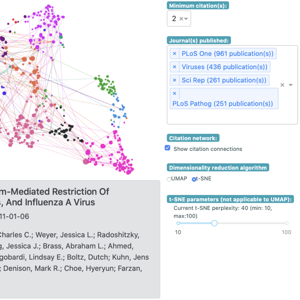
Take your interactive plots in Python to the next level with advanced Python graphing techniques, including plotting CSV data, generating random walks, peak finding, data smoothing, and rendering LaTeX.

  • Plot CSV Data
  • Random Walk
  • Peak Finding
  • Smoothing
  • LaTeX
You are visitor 01402503 — GeezerVison does not store the pages you look up.
Best viewed with Netscape Navigator 4.7 or Internet Explorer 6 at 800×600. No cookies required.