GeezerVisonThe World Wide Web, restored to 800 pixels of glory. |
| Home|About|Gaming cabinet|Archives|How it works|Starter sites |
GeezerVison is showing pythonot.github.io — Wasserstein Discriminant Analysis — POT Python Optimal Transport 0.9.7 documentation Note Go to the end to download the full example code. Wasserstein Discriminant AnalysisNote Example added in release: 0.3.0. This example illustrate the use of WDA as proposed in [11]. [11] Flamary, R., Cuturi, M., Courty, N., & Rakotomamonjy, A. (2016). Wasserstein Discriminant Analysis. # Author: Remi Flamary <[email protected]> # # License: MIT License # sphinx_gallery_thumbnail_number = 2 import numpy as np import matplotlib.pylab as pl from ot.dr import wda, fda Generate datan = 1000 # nb samples in source and target datasets nz = 0.2 np.random.seed(1) # generate circle dataset t = np.random.rand(n) * 2 * np.pi ys = np.floor((np.arange(n) * 1.0 / n * 3)) + 1 xs = np.concatenate((np.cos(t).reshape((-1, 1)), np.sin(t).reshape((-1, 1))), 1) xs = xs * ys.reshape(-1, 1) + nz * np.random.randn(n, 2) t = np.random.rand(n) * 2 * np.pi yt = np.floor((np.arange(n) * 1.0 / n * 3)) + 1 xt = np.concatenate((np.cos(t).reshape((-1, 1)), np.sin(t).reshape((-1, 1))), 1) xt = xt * yt.reshape(-1, 1) + nz * np.random.randn(n, 2) nbnoise = 8 xs = np.hstack((xs, np.random.randn(n, nbnoise))) xt = np.hstack((xt, np.random.randn(n, nbnoise))) Plot datapl.figure(1, figsize=(6.4, 3.5)) pl.subplot(1, 2, 1) pl.scatter(xt[:, 0], xt[:, 1], c=ys, marker="+", label="Source samples") pl.legend(loc=0) pl.title("Discriminant dimensions") pl.subplot(1, 2, 2) pl.scatter(xt[:, 2], xt[:, 3], c=ys, marker="+", label="Source samples") pl.legend(loc=0) pl.title("Other dimensions") pl.tight_layout() 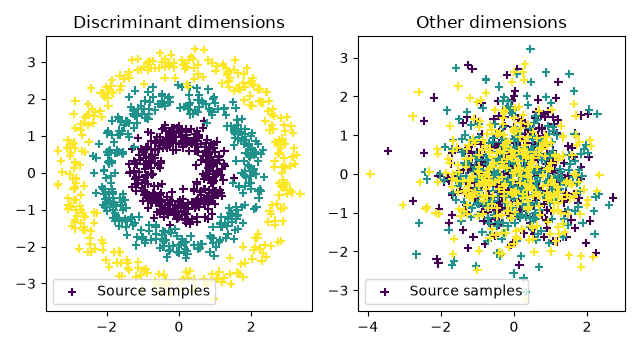 Compute Fisher Discriminant AnalysisCompute Wasserstein Discriminant AnalysisOptimizing... Iteration Cost Gradient norm --------- ----------------------- -------------- 1 +8.3042776946697483e-01 5.65147154e-01 2 +4.4401037686381040e-01 2.16760501e-01 3 +4.2234351238819928e-01 1.30555049e-01 4 +4.2169879996364479e-01 1.39115407e-01 5 +4.1924746118060674e-01 1.25387848e-01 6 +4.1177409528990933e-01 6.70993539e-02 7 +4.0862213476139003e-01 3.52716830e-02 8 +4.0747229322240336e-01 3.34923131e-02 9 +4.0678766065261329e-01 2.74029183e-02 10 +4.0621337155459925e-01 2.03651803e-02 11 +4.0577080390746961e-01 2.59605592e-02 12 +4.0543140912477149e-01 3.28883715e-02 13 +4.0470236926311942e-01 1.47528039e-02 14 +4.0445628467113731e-01 5.03183253e-02 15 +4.0364189454514843e-01 3.31006501e-02 16 +4.0303977564978699e-01 1.39885362e-02 17 +4.0301476232780259e-01 2.17467590e-02 18 +4.0292344279343950e-01 1.79959771e-02 19 +4.0271888307907128e-01 6.94408749e-03 20 +4.0183215737046896e-01 1.98326640e-02 21 +3.9762707100593531e-01 1.03195400e-01 22 +3.8225988079706485e-01 1.35998904e-01 23 +3.0856544070652298e-01 1.92703391e-01 24 +2.7998481492927213e-01 2.01878706e-01 25 +2.3693225637656293e-01 9.05665571e-02 26 +2.3416660805509620e-01 7.09781011e-02 27 +2.3173761386491401e-01 4.03937487e-02 28 +2.3061384109180777e-01 3.70147365e-03 29 +2.3061161834370525e-01 3.25958826e-03 30 +2.3060547914991694e-01 1.24366264e-03 31 +2.3060465305946115e-01 5.78888734e-04 32 +2.3060458219792498e-01 4.79935562e-04 33 +2.3060442824951685e-01 4.16489862e-05 34 +2.3060442707775350e-01 1.55904146e-06 35 +2.3060442707614406e-01 5.08692969e-07 Terminated - min grad norm reached after 35 iterations, 4.47 seconds. Plot 2D projectionsxsp = projfda(xs) xtp = projfda(xt) xspw = projwda(xs) xtpw = projwda(xt) pl.figure(2) pl.subplot(2, 2, 1) pl.scatter(xsp[:, 0], xsp[:, 1], c=ys, marker="+", label="Projected samples") pl.legend(loc=0) pl.title("Projected training samples FDA") pl.subplot(2, 2, 2) pl.scatter(xtp[:, 0], xtp[:, 1], c=ys, marker="+", label="Projected samples") pl.legend(loc=0) pl.title("Projected test samples FDA") pl.subplot(2, 2, 3) pl.scatter(xspw[:, 0], xspw[:, 1], c=ys, marker="+", label="Projected samples") pl.legend(loc=0) pl.title("Projected training samples WDA") pl.subplot(2, 2, 4) pl.scatter(xtpw[:, 0], xtpw[:, 1], c=ys, marker="+", label="Projected samples") pl.legend(loc=0) pl.title("Projected test samples WDA") pl.tight_layout() pl.show() 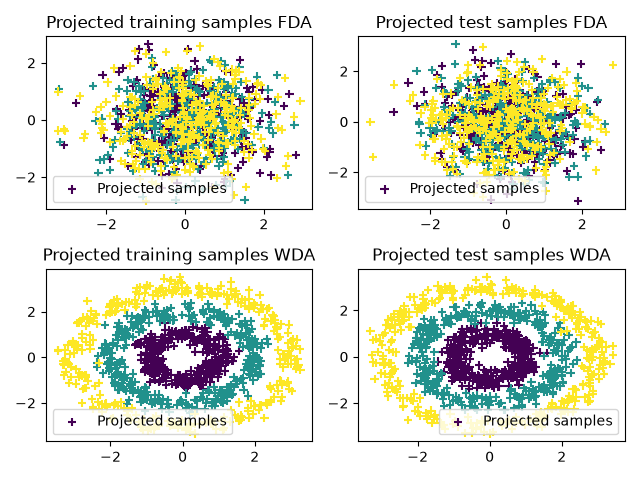 /home/circleci/.local/lib/python3.12/site-packages/matplotlib/cbook.py:1810: ComplexWarning: Casting complex values to real discards the imaginary part return math.isfinite(val) /home/circleci/.local/lib/python3.12/site-packages/matplotlib/collections.py:205: ComplexWarning: Casting complex values to real discards the imaginary part offsets = np.asanyarray(offsets, float) Total running time of the script: (0 minutes 5.086 seconds)
Python Optimal Transport 0.9.7
Versions: Release Development Code |
| You are visitor 01402520 — GeezerVison does not store the pages you look up. Best viewed with Netscape Navigator 4.7 or Internet Explorer 6 at 800×600. No cookies required. |