GV

GeezerVison

The World Wide Web, restored to 800 pixels of glory.

Home|About|Gaming cabinet|Archives|How it works|Starter sites

On this site

  • Home
  • +=1
  • Support the Content
  • Community
  • Log in
  • Sign up

This view

  • Original page
  • New address

GeezerVison is showing pythonprogramming.net — Python Programming Tutorials

Scatter Plots with Matplotlib


Next up, we cover scatter plots! The idea of scatter plots is usually to compare two variables, or three if you are plotting in 3 dimensions, looking for correlation or groups.

Some sample code for a scatter plot:

import matplotlib.pyplot as plt

x = [1,2,3,4,5,6,7,8]
y = [5,2,4,2,1,4,5,2]

plt.scatter(x,y, label='skitscat', color='k', s=25, marker="o")

plt.xlabel('x')
plt.ylabel('y')
plt.title('Interesting Graph\nCheck it out')
plt.legend()
plt.show()

The result:
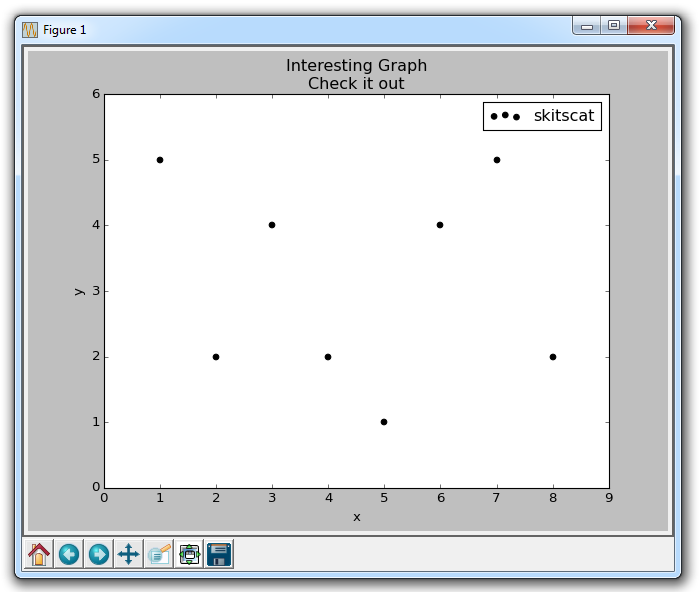
The plt.scatter allows us to not only plot on x and y, but it also lets us decide on the color, size, and type of marker we use. There are a bunch of marker options, see the Matplotlib Marker Documentation for all of your choices.
The next tutorial:


  • Introduction to Matplotlib and basic line

  • Legends, Titles, and Labels with Matplotlib

  • Bar Charts and Histograms with Matplotlib

  • Scatter Plots with Matplotlib
  • Stack Plots with Matplotlib

  • Pie Charts with Matplotlib

  • Loading Data from Files for Matplotlib

  • Data from the Internet for Matplotlib

  • Converting date stamps for Matplotlib

  • Basic customization with Matplotlib

  • Unix Time with Matplotlib

  • Colors and Fills with Matplotlib

  • Spines and Horizontal Lines with Matplotlib

  • Candlestick OHLC graphs with Matplotlib

  • Styles with Matplotlib

  • Live Graphs with Matplotlib

  • Annotations and Text with Matplotlib

  • Annotating Last Price Stock Chart with Matplotlib

  • Subplots with Matplotlib

  • Implementing Subplots to our Chart with Matplotlib

  • More indicator data with Matplotlib

  • Custom fills, pruning, and cleaning with Matplotlib

  • Share X Axis, sharex, with Matplotlib

  • Multi Y Axis with twinx Matplotlib

  • Custom Legends with Matplotlib

  • Basemap Geographic Plotting with Matplotlib

  • Basemap Customization with Matplotlib

  • Plotting Coordinates in Basemap with Matplotlib

  • 3D graphs with Matplotlib

  • 3D Scatter Plot with Matplotlib

  • 3D Bar Chart with Matplotlib

  • Conclusion with Matplotlib

You are visitor 01402520 — GeezerVison does not store the pages you look up.
Best viewed with Netscape Navigator 4.7 or Internet Explorer 6 at 800×600. No cookies required.