Note
Go to the end to download the full example code or to run this example in your browser via JupyterLite or Binder.
Blind source separation using FastICA#
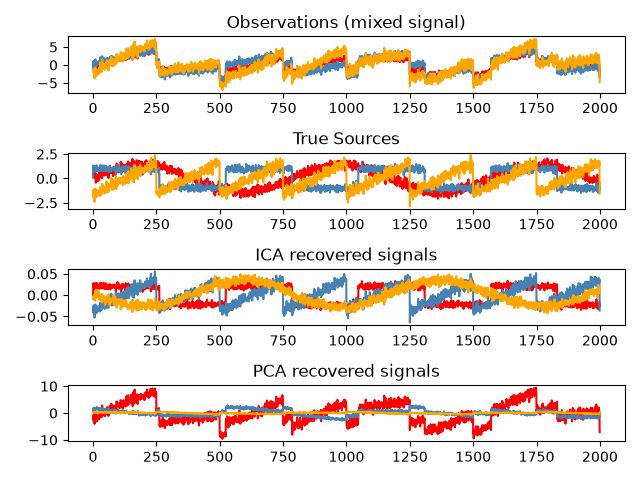
An example of estimating sources from noisy data.
Independent component analysis (ICA) is used to estimate sources given noisy measurements.
Imagine 3 instruments playing simultaneously and 3 microphones
recording the mixed signals. ICA is used to recover the sources
ie. what is played by each instrument. Importantly, PCA fails
at recovering our instruments since the related signals reflect
non-Gaussian processes.
# Authors: The scikit-learn developers
# SPDX-License-Identifier: BSD-3-Clause
Generate sample data#
import numpy as np
from scipy import signal

np.random.seed(0)
n_samples = 2000
time = np.linspace(0, 8, n_samples)

s1 = np.sin(2 * time)  # Signal 1 : sinusoidal signal
s2 = np.sign(np.sin(3 * time))  # Signal 2 : square signal
s3 = signal.sawtooth(2 * np.pi * time)  # Signal 3: saw tooth signal

S = np.c_[s1, s2, s3]
S += 0.2 * np.random.normal(size=S.shape)  # Add noise

S /= S.std(axis=0)  # Standardize data
# Mix data
A = np.array([[1, 1, 1], [0.5, 2, 1.0], [1.5, 1.0, 2.0]])  # Mixing matrix
X = np.dot(S, A.T)  # Generate observations
Fit ICA and PCA models#
from sklearn.decomposition import PCA, FastICA

# Compute ICA
ica = FastICA(n_components=3, whiten="arbitrary-variance")
S_ = ica.fit_transform(X)  # Reconstruct signals
A_ = ica.mixing_  # Get estimated mixing matrix

# We can `prove` that the ICA model applies by reverting the unmixing.
assert np.allclose(X, np.dot(S_, A_.T) + ica.mean_)

# For comparison, compute PCA
pca = PCA(n_components=3)
H = pca.fit_transform(X)  # Reconstruct signals based on orthogonal components
Plot results#
import matplotlib.pyplot as plt

plt.figure()

models = [X, S, S_, H]
names = [
    "Observations (mixed signal)",
    "True Sources",
    "ICA recovered signals",
    "PCA recovered signals",
]
colors = ["red", "steelblue", "orange"]

for ii, (model, name) in enumerate(zip(models, names), 1):
    plt.subplot(4, 1, ii)
    plt.title(name)
    for sig, color in zip(model.T, colors):
        plt.plot(sig, color=color)

plt.tight_layout()
plt.show()
Total running time of the script: (0 minutes 0.391 seconds)


Related examples


Comparison of kernel ridge and Gaussian process regression
Comparison of kernel ridge and Gaussian process regression

Ability of Gaussian process regression (GPR) to estimate data noise-level
Ability of Gaussian process regression (GPR) to estimate data noise-level