GeezerVison is showing scikit-learn.org — Visualizations with Display Objects
Note
Go to the end
to download the full example code or to run this example in your browser via JupyterLite or Binder.
Visualizations with Display Objects#
In this example, we will construct display objects,
ConfusionMatrixDisplay, RocCurveDisplay, and
PrecisionRecallDisplay directly from their respective metrics. This
is an alternative to using their corresponding plot functions when
a model’s predictions are already computed or expensive to compute. Note that
this is advanced usage, and in general we recommend using their respective
plot functions.
# Authors: The scikit-learn developers
# SPDX-License-Identifier: BSD-3-Clause
Load Data and train model#
For this example, we load a blood transfusion service center data set from
OpenML. This is a binary classification
problem where the target is whether an individual donated blood. Then the
data is split into a train and test dataset and a logistic regression is
fitted with the train dataset.
Pipeline(steps=[('standardscaler', StandardScaler()),
                ('logisticregression', LogisticRegression(random_state=0))])
In a Jupyter environment, please rerun this cell to show the HTML representation or trust the notebook.
On GitHub, the HTML representation is unable to render, please try loading this page with nbviewer.org.
Parameters
|
steps
steps: list of tuples
List of (name of step, estimator) tuples that are to be chained in
sequential order. To be compatible with the scikit-learn API, all steps
must define `fit`. All non-last steps must also define `transform`. See
:ref:`Combining Estimators <combining_estimators>` for more details.
|
[('standardscaler', ...), ('logisticregression', ...)] |
|
transform_input
transform_input: list of str, default=None
The names of the :term:`metadata` parameters that should be transformed by the
pipeline before passing it to the step consuming it.
This enables transforming some input arguments to ``fit`` (other than ``X``)
to be transformed by the steps of the pipeline up to the step which requires
them. Requirement is defined via :ref:`metadata routing <metadata_routing>`.
For instance, this can be used to pass a validation set through the pipeline.
You can only set this if metadata routing is enabled, which you
can enable using ``sklearn.set_config(enable_metadata_routing=True)``.
.. versionadded:: 1.6
|
None |
|
memory
memory: str or object with the joblib.Memory interface, default=None
Used to cache the fitted transformers of the pipeline. The last step
will never be cached, even if it is a transformer. By default, no
caching is performed. If a string is given, it is the path to the
caching directory. Enabling caching triggers a clone of the transformers
before fitting. Therefore, the transformer instance given to the
pipeline cannot be inspected directly. Use the attribute ``named_steps``
or ``steps`` to inspect estimators within the pipeline. Caching the
transformers is advantageous when fitting is time consuming. See
:ref:`sphx_glr_auto_examples_neighbors_plot_caching_nearest_neighbors.py`
for an example on how to enable caching.
|
None |
|
verbose
verbose: bool, default=False
If True, the time elapsed while fitting each step will be printed as it
is completed.
|
False |
Fitted attributes
| Name |
Type |
Value |
feature_names_in_
feature_names_in_: ndarray of shape (`n_features_in_`,)
Names of features seen during :term:`fit`. Defined only when `X`
has feature names that are all strings.
.. versionadded:: 1.0
|
ndarray[object](4,) |
['V1','V2','V3','V4'] |
mean_
mean_: ndarray of shape (n_features,) or None
The mean value for each feature in the training set.
Equal to ``None`` when ``with_mean=False`` and ``with_std=False``.
|
ndarray[float64](4,) |
[ 9.82, 5.32,1330.66, 34.18] |
n_features_in_
n_features_in_: int
Number of features seen during :term:`fit`.
.. versionadded:: 0.24
|
int |
4 |
n_samples_seen_
n_samples_seen_: int or ndarray of shape (n_features,)
The number of samples processed by the estimator for each feature.
If there are no missing samples, the ``n_samples_seen`` will be an
integer, otherwise it will be an array of dtype int. If
`sample_weights` are used it will be a float (if no missing data)
or an array of dtype float that sums the weights seen so far.
Will be reset on new calls to fit, but increments across
``partial_fit`` calls.
|
float64 |
561 |
scale_
scale_: ndarray of shape (n_features,) or None
Per feature relative scaling of the data to achieve zero mean and unit
variance. Generally this is calculated using `np.sqrt(var_)`. If a
variance is zero, we can't achieve unit variance, and the data is left
as-is, giving a scaling factor of 1. `scale_` is equal to `None`
when `with_std=False`.
.. versionadded:: 0.17
*scale_*
|
ndarray[float64](4,) |
[ 8.3 , 5.34,1335.97, 23.33] |
var_
var_: ndarray of shape (n_features,) or None
The variance for each feature in the training set. Used to compute
`scale_`. Equal to ``None`` when ``with_mean=False`` and
``with_std=False``.
|
ndarray[float64](4,) |
[ 68.95, 28.56,1784826.48, 544.31] |
Parameters
|
random_state
random_state: int, RandomState instance, default=None
Only used for `solver` == 'sag', 'saga' or 'liblinear' to shuffle the
data. It has no effect on the other solvers.
See :term:`Glossary <random_state>` for details.
|
0 |
|
penalty
penalty: {'l1', 'l2', 'elasticnet', None}, default='l2'
Specify the norm of the penalty:
- `None`: no penalty is added;
- `'l2'`: add an L2 penalty term and it is the default choice;
- `'l1'`: add an L1 penalty term;
- `'elasticnet'`: both L1 and L2 penalty terms are added.
.. warning::
Some penalties may not work with some solvers. See the parameter
`solver` below, to know the compatibility between the penalty and
solver.
.. versionadded:: 0.19
l1 penalty with SAGA solver (allowing 'multinomial' + L1)
.. deprecated:: 1.8
`penalty` was deprecated in version 1.8 and will be removed in 1.10.
Use `l1_ratio` and `C` instead. `l1_ratio=0` for `penalty='l2'`,
`l1_ratio=1` for `penalty='l1'`, `l1_ratio` set to any float between 0 and 1
for `penalty='elasticnet'`, and `C=np.inf` for `penalty=None`.
|
'deprecated' |
|
C
C: float, default=1.0
Inverse of regularization strength; must be a positive float.
Like in support vector machines, smaller values specify stronger
regularization. `C=np.inf` results in unpenalized logistic regression.
For a visual example on the effect of tuning the `C` parameter
with an L1 penalty, see:
:ref:`sphx_glr_auto_examples_linear_model_plot_logistic_path.py`.
|
1.0 |
|
l1_ratio
l1_ratio: float, default=0.0
The Elastic-Net mixing parameter, with `0 <= l1_ratio <= 1`. Setting
`l1_ratio=1` gives a pure L1-penalty, setting `l1_ratio=0` a pure L2-penalty.
Any value between 0 and 1 gives an Elastic-Net penalty of the form
`l1_ratio * L1 + (1 - l1_ratio) * L2`.
.. warning::
Certain values of `l1_ratio`, i.e. some penalties, may not work with some
solvers. See the parameter `solver` below, to know the compatibility between
the penalty and solver.
.. versionchanged:: 1.8
Default value changed from None to 0.0.
.. deprecated:: 1.8
`None` is deprecated and will be removed in version 1.10. Always use
`l1_ratio` to specify the penalty type.
|
0.0 |
|
dual
dual: bool, default=False
Dual (constrained) or primal (regularized, see also
:ref:`this equation <regularized-logistic-loss>`) formulation. Dual formulation
is only implemented for l2 penalty with liblinear solver. Prefer `dual=False`
when n_samples > n_features.
|
False |
|
tol
tol: float, default=1e-4
Tolerance for stopping criteria.
|
0.0001 |
|
fit_intercept
fit_intercept: bool, default=True
Specifies if a constant (a.k.a. bias or intercept) should be
added to the decision function.
|
True |
|
intercept_scaling
intercept_scaling: float, default=1
Useful only when the solver `liblinear` is used
and `self.fit_intercept` is set to `True`. In this case, `x` becomes
`[x, self.intercept_scaling]`,
i.e. a "synthetic" feature with constant value equal to
`intercept_scaling` is appended to the instance vector.
The intercept becomes
``intercept_scaling * synthetic_feature_weight``.
.. note::
The synthetic feature weight is subject to L1 or L2
regularization as all other features.
To lessen the effect of regularization on synthetic feature weight
(and therefore on the intercept) `intercept_scaling` has to be increased.
|
1 |
|
class_weight
class_weight: dict or 'balanced', default=None
Weights associated with classes in the form ``{class_label: weight}``.
If not given, all classes are supposed to have weight one.
The "balanced" mode uses the values of y to automatically adjust
weights inversely proportional to class frequencies in the input data
as ``n_samples / (n_classes * np.bincount(y))``.
Note that these weights will be multiplied with sample_weight (passed
through the fit method) if sample_weight is specified.
.. versionadded:: 0.17
*class_weight='balanced'*
|
None |
|
solver
solver: {'lbfgs', 'liblinear', 'newton-cg', 'newton-cholesky', 'sag', 'saga'}, default='lbfgs'
Algorithm to use in the optimization problem. Default is 'lbfgs'.
To choose a solver, you might want to consider the following aspects:
- 'lbfgs' is a good default solver because it works reasonably well for a wide
class of problems.
- For :term:`multiclass` problems (`n_classes >= 3`), all solvers except
'liblinear' minimize the full multinomial loss, 'liblinear' will raise an
error.
- 'newton-cholesky' is a good choice for
`n_samples` >> `n_features * n_classes`, especially with one-hot encoded
categorical features with rare categories. Be aware that the memory usage
of this solver has a quadratic dependency on `n_features * n_classes`
because it explicitly computes the full Hessian matrix.
- For small datasets, 'liblinear' is a good choice, whereas 'sag'
and 'saga' are faster for large ones;
- 'liblinear' can only handle binary classification by default. To apply a
one-versus-rest scheme for the multiclass setting one can wrap it with the
:class:`~sklearn.multiclass.OneVsRestClassifier`.
.. warning::
The choice of the algorithm depends on the penalty chosen (`l1_ratio=0`
for L2-penalty, `l1_ratio=1` for L1-penalty and `0 < l1_ratio < 1` for
Elastic-Net) and on (multinomial) multiclass support:
================= ======================== ======================
solver l1_ratio multinomial multiclass
================= ======================== ======================
'lbfgs' l1_ratio=0 yes
'liblinear' l1_ratio=1 or l1_ratio=0 no
'newton-cg' l1_ratio=0 yes
'newton-cholesky' l1_ratio=0 yes
'sag' l1_ratio=0 yes
'saga' 0<=l1_ratio<=1 yes
================= ======================== ======================
.. note::
'sag' and 'saga' fast convergence is only guaranteed on features
with approximately the same scale. You can preprocess the data with
a scaler from :mod:`sklearn.preprocessing`.
.. seealso::
Refer to the :ref:`User Guide <Logistic_regression>` for more
information regarding :class:`LogisticRegression` and more specifically the
:ref:`Table <logistic_regression_solvers>`
summarizing solver/penalty supports.
.. versionadded:: 0.17
Stochastic Average Gradient (SAG) descent solver. Multinomial support in
version 0.18.
.. versionadded:: 0.19
SAGA solver.
.. versionchanged:: 0.22
The default solver changed from 'liblinear' to 'lbfgs' in 0.22.
.. versionadded:: 1.2
newton-cholesky solver. Multinomial support in version 1.6.
|
'lbfgs' |
|
max_iter
max_iter: int, default=100
Maximum number of iterations taken for the solvers to converge.
|
100 |
|
verbose
verbose: int, default=0
For the liblinear and lbfgs solvers set verbose to any positive
number for verbosity.
|
0 |
|
warm_start
warm_start: bool, default=False
When set to True, reuse the solution of the previous call to fit as
initialization, otherwise, just erase the previous solution.
Useless for liblinear solver. See :term:`the Glossary <warm_start>`.
.. versionadded:: 0.17
*warm_start* to support *lbfgs*, *newton-cg*, *sag*, *saga* solvers.
|
False |
|
n_jobs
n_jobs: int, default=None
Does not have any effect.
.. deprecated:: 1.8
`n_jobs` is deprecated in version 1.8 and will be removed in 1.10.
|
None |
Fitted attributes
| Name |
Type |
Value |
classes_
classes_: ndarray of shape (n_classes, )
A list of class labels known to the classifier.
|
ndarray[object](2,) |
['1','2'] |
coef_
coef_: ndarray or CSR matrix of shape (1, n_features) or (n_classes, n_features)
Coefficients of the features in the decision function.
`coef_` is of shape (1, n_features) when the given problem is binary.
By default, it will be created as a dense array, but can be turned to
sparse (CSR format) through :meth:`sparsify` (which can be beneficial
under L1 regularization when many coefficients are zero), and back to
dense through :meth:`densify`.
|
ndarray[float64](1, 4) |
[[-0.74, 0.38, 0.38,-0.53]] |
intercept_
intercept_: ndarray of shape (1,) or (n_classes,)
Intercept (a.k.a. bias) added to the decision function.
If `fit_intercept` is set to False, the intercept is set to zero.
`intercept_` is of shape (1,) when the given problem is binary.
|
ndarray[float64](1,) |
[-1.41] |
n_features_in_
n_features_in_: int
Number of features seen during :term:`fit`.
.. versionadded:: 0.24
|
int |
4 |
n_iter_
n_iter_: ndarray of shape (1, )
Actual number of iterations for all classes.
.. versionchanged:: 0.20
In SciPy <= 1.0.0 the number of lbfgs iterations may exceed
``max_iter``. ``n_iter_`` will now report at most ``max_iter``.
|
ndarray[int32](1,) |
[8] |
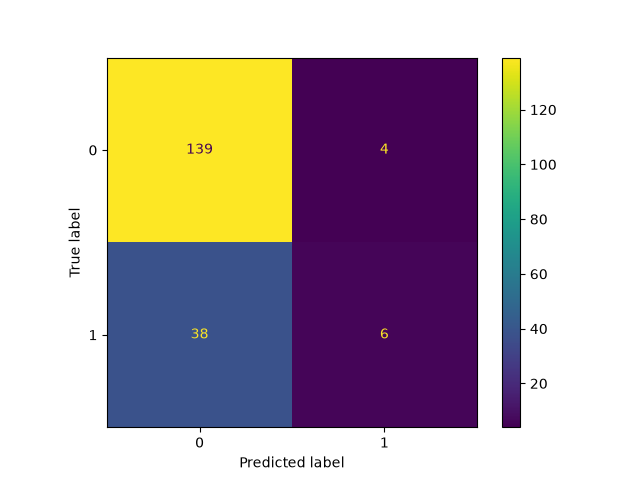
With the fitted model, we compute the predictions of the model on the test
dataset. These predictions are used to compute the confusion matrix which
is plotted with the ConfusionMatrixDisplay
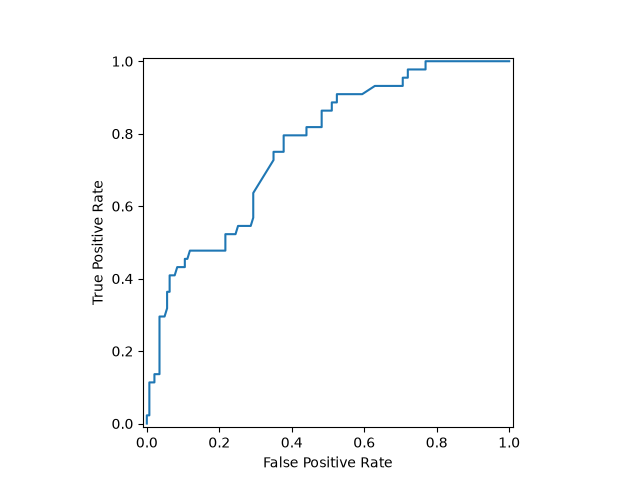
The roc curve requires either the probabilities or the non-thresholded
decision values from the estimator. Since the logistic regression provides
a decision function, we will use it to plot the roc curve:
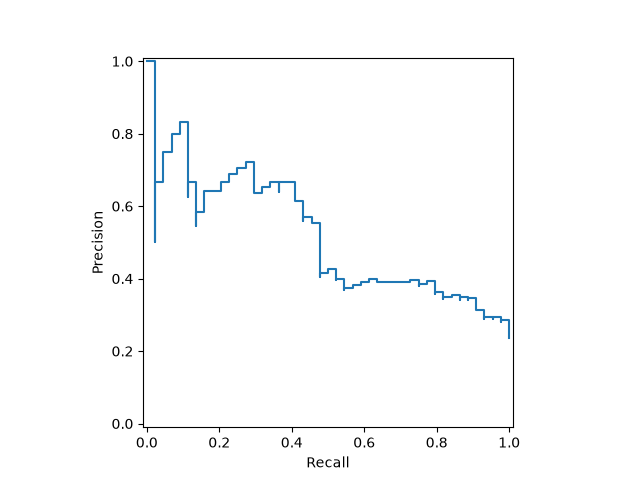
Similarly, the precision recall curve can be plotted using y_score from
the prevision sections.
Combining the display objects into a single plot#
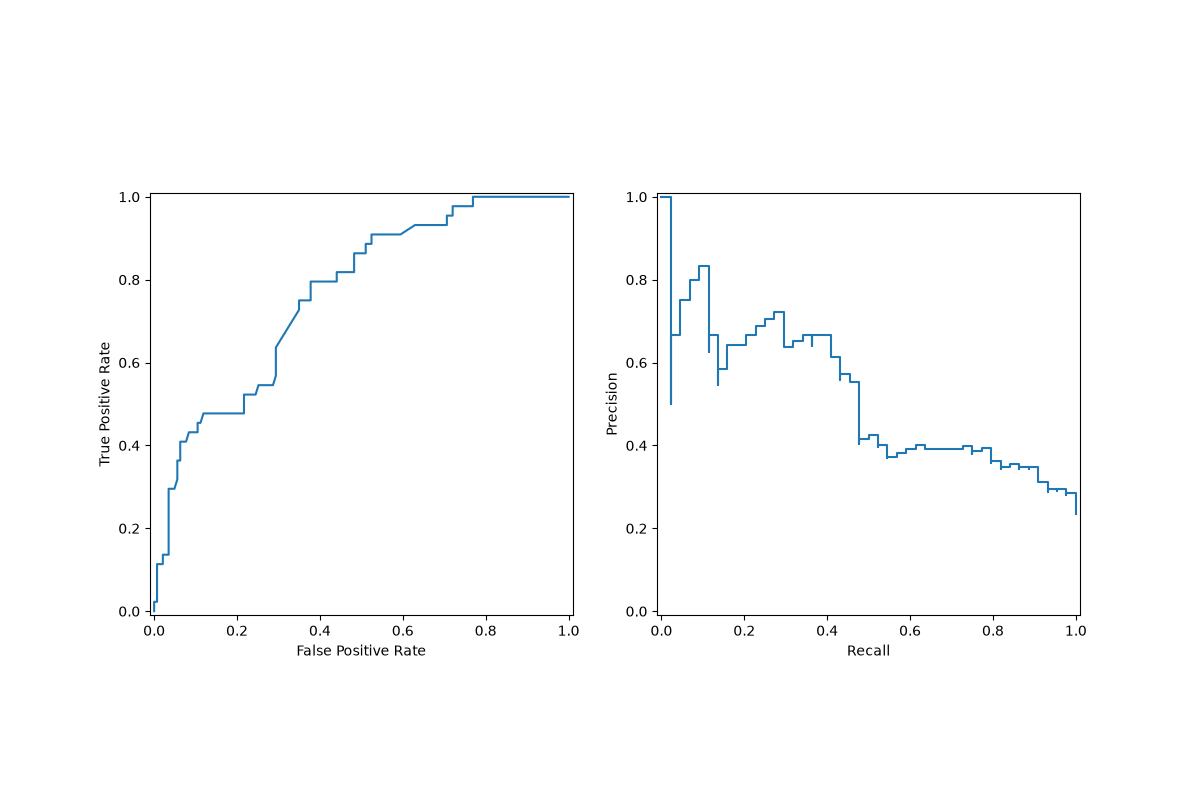
The display objects store the computed values that were passed as arguments.
This allows for the visualizations to be easily combined using matplotlib’s
API. In the following example, we place the displays next to each other in a
row.
import matplotlib.pyplot as plt

fig, (ax1, ax2) = plt.subplots(1, 2, figsize=(12, 8))

roc_display.plot(ax=ax1)
pr_display.plot(ax=ax2)
plt.show()
 Total running time of the script: (0 minutes 0.308 seconds)
Related examples
Gallery generated by Sphinx-Gallery
|