Python error monitoring with actionable insight into every exception. See the full picture behind any Python error, resolve performance bottlenecks, and get framework-specific coverage that spans Django application monitoring, Flask, FastAPI, and Celery.
Initialize the SDK as early as possible in your application:
Python
import sentry_sdksentry_sdk.init( dsn="https://<key>@sentry.io/<project>", # Add data like request headers and IP for users, if applicable; # see https://docs.sentry.io/platforms/python/data-management/data-collected/ for more info send_default_pii=True, # Set traces_sample_rate to 1.0 to capture 100% # of transactions for tracing. # We recommend adjusting this value in production. traces_sample_rate=1.0,)
Initialize the SDK as early as possible in your application:
Python
import sentry_sdksentry_sdk.init( dsn="https://<key>@sentry.io/<project>", # Add data like request headers and IP for users, if applicable; # see https://docs.sentry.io/platforms/python/data-management/data-collected/ for more info send_default_pii=True, # Set traces_sample_rate to 1.0 to capture 100% # of transactions for tracing. # We recommend adjusting this value in production. traces_sample_rate=1.0,)
Initialize the SDK in your settings.py file. The Django integration is enabled automatically.
Python
import sentry_sdksentry_sdk.init( dsn="https://<key>@sentry.io/<project>", # Add data like request headers and IP for users, if applicable; # see https://docs.sentry.io/platforms/python/data-management/data-collected/ for more info send_default_pii=True, # Set traces_sample_rate to 1.0 to capture 100% # of transactions for tracing. # We recommend adjusting this value in production. traces_sample_rate=1.0,)
Initialize the SDK before creating your app. The Flask integration is enabled automatically.
Python
import sentry_sdkfrom flask import Flasksentry_sdk.init( dsn="https://<key>@sentry.io/<project>", # Add data like request headers and IP for users, if applicable; # see https://docs.sentry.io/platforms/python/data-management/data-collected/ for more info send_default_pii=True, # Set traces_sample_rate to 1.0 to capture 100% # of transactions for tracing. # We recommend adjusting this value in production. traces_sample_rate=1.0,)app = Flask(__name__)
Initialize the SDK before creating your app. The FastAPI integration is enabled automatically.
Python
import sentry_sdkfrom fastapi import FastAPIsentry_sdk.init( dsn="https://<key>@sentry.io/<project>", # Add data like request headers and IP for users, if applicable; # see https://docs.sentry.io/platforms/python/data-management/data-collected/ for more info send_default_pii=True, # Set traces_sample_rate to 1.0 to capture 100% # of transactions for tracing. # We recommend adjusting this value in production. traces_sample_rate=1.0,)app = FastAPI()
Initialize the SDK before your app is created. The Bottle integration is enabled automatically.
Python
import sentry_sdkfrom bottle import Bottlesentry_sdk.init( dsn="https://<key>@sentry.io/<project>", # Add data like request headers and IP for users, if applicable; # see https://docs.sentry.io/platforms/python/data-management/data-collected/ for more info send_default_pii=True, # Set traces_sample_rate to 1.0 to capture 100% # of transactions for tracing. # We recommend adjusting this value in production. traces_sample_rate=1.0,)app = Bottle()
Initialize the SDK when the Celery worker starts (not only in the module where your tasks are defined). The Celery integration is enabled automatically.
Python
import sentry_sdkfrom celery import Celery, signalsapp = Celery("tasks", broker="...")@signals.celeryd_init.connectdef init_sentry(**_kwargs): sentry_sdk.init( dsn="https://<key>@sentry.io/<project>", # Add data like request headers and IP for users, if applicable; # see https://docs.sentry.io/platforms/python/data-management/data-collected/ for more info send_default_pii=True, # Set traces_sample_rate to 1.0 to capture 100% # of transactions for tracing. # We recommend adjusting this value in production. traces_sample_rate=1.0, )
If you use Celery with Django and already initialize Sentry in settings.py, no extra setup is needed.
Initialize the SDK before or after your app has been created. The Pyramid integration is enabled automatically.
Python
import sentry_sdkfrom pyramid.config import Configuratorsentry_sdk.init( dsn="https://<key>@sentry.io/<project>", # Add data like request headers and IP for users, if applicable; # see https://docs.sentry.io/platforms/python/data-management/data-collected/ for more info send_default_pii=True, # Set traces_sample_rate to 1.0 to capture 100% # of transactions for tracing. # We recommend adjusting this value in production. traces_sample_rate=1.0,)with Configurator() as config: # ...
Initialize the SDK before your app starts. The Tornado integration is enabled automatically.
Python
import sentry_sdksentry_sdk.init( dsn="https://<key>@sentry.io/<project>", # Add data like request headers and IP for users, if applicable; # see https://docs.sentry.io/platforms/python/data-management/data-collected/ for more info send_default_pii=True, # Set traces_sample_rate to 1.0 to capture 100% # of transactions for tracing. # We recommend adjusting this value in production. traces_sample_rate=1.0,)# Your app code here, without changesclass MyHandler(...): # ...
Create a file called mysettings.py with the following content. The RQ integration is enabled automatically.
Python
import sentry_sdksentry_sdk.init( dsn="https://<key>@sentry.io/<project>", # Add data like request headers and IP for users, if applicable; # see https://docs.sentry.io/platforms/python/data-management/data-collected/ for more info send_default_pii=True, # Set traces_sample_rate to 1.0 to capture 100% # of transactions for tracing. # We recommend adjusting this value in production. traces_sample_rate=1.0,)
Start your worker with:
Bash
rq worker -c mysettings
Install our Python SDK into your deployment package using pip:
Then use the AWS Lambda integration for the Python SDK like this:
Python
import sentry_sdkfrom sentry_sdk.integrations.aws_lambda import AwsLambdaIntegrationsentry_sdk.init( dsn="https://<key>@sentry.io/<project>", # Add data like request headers and IP for users, if applicable; # see https://docs.sentry.io/platforms/python/data-management/data-collected/ for more info send_default_pii=True, # Set traces_sample_rate to 1.0 to capture 100% # of transactions for tracing. # We recommend adjusting this value in production. traces_sample_rate=1.0, integrations=[AwsLambdaIntegration()],)def lambda_handler(event, context): # ...
Add the Sentry SDK to your requirements.txt:
Text
sentry-sdk
Then use the GCP Functions integration for the Python SDK like this:
Python
import sentry_sdkfrom sentry_sdk.integrations.gcp import GcpIntegrationsentry_sdk.init( dsn="https://<key>@sentry.io/<project>", # Add data like request headers and IP for users, if applicable; # see https://docs.sentry.io/platforms/python/data-management/data-collected/ for more info send_default_pii=True, # Set traces_sample_rate to 1.0 to capture 100% # of transactions for tracing. # We recommend adjusting this value in production. traces_sample_rate=1.0, integrations=[GcpIntegration()],)def http_function_entrypoint(request): # ...
The GCP integration supports the Python 3.7 runtime. On newer runtimes, use the serverless_function decorator instead.
Check our documentation
for the latest instructions.
More than 200K Organizations Trust Sentry with Their Application Monitoring
Python Performance Monitoring
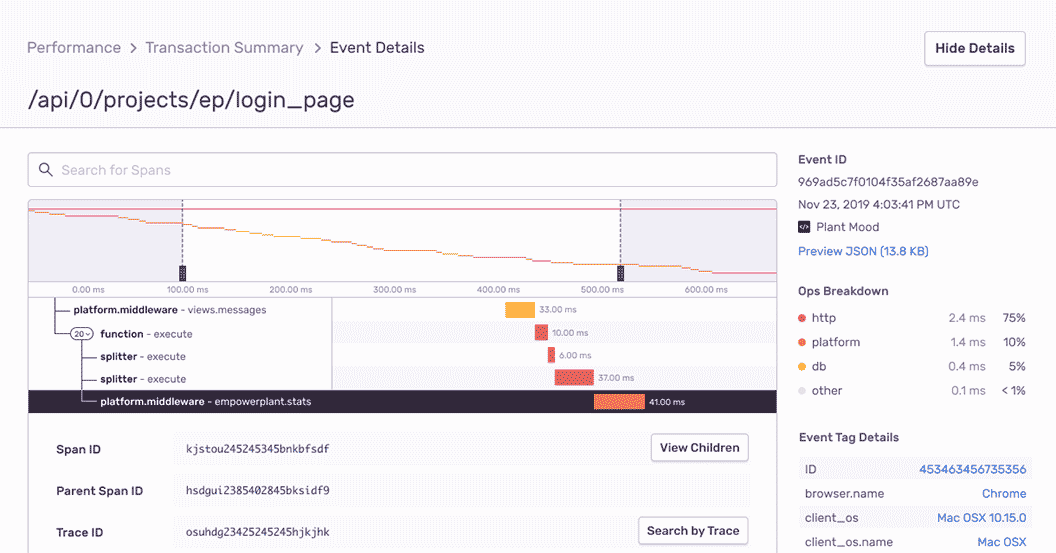
Within minutes after installing Sentry, software teams can trace Python performance issues back to a poor-performing API call and surface every related code error. From Django application monitoring to FastAPI performance, engineering managers and developers get a single tool to optimize their code and deliver fast customer experiences.
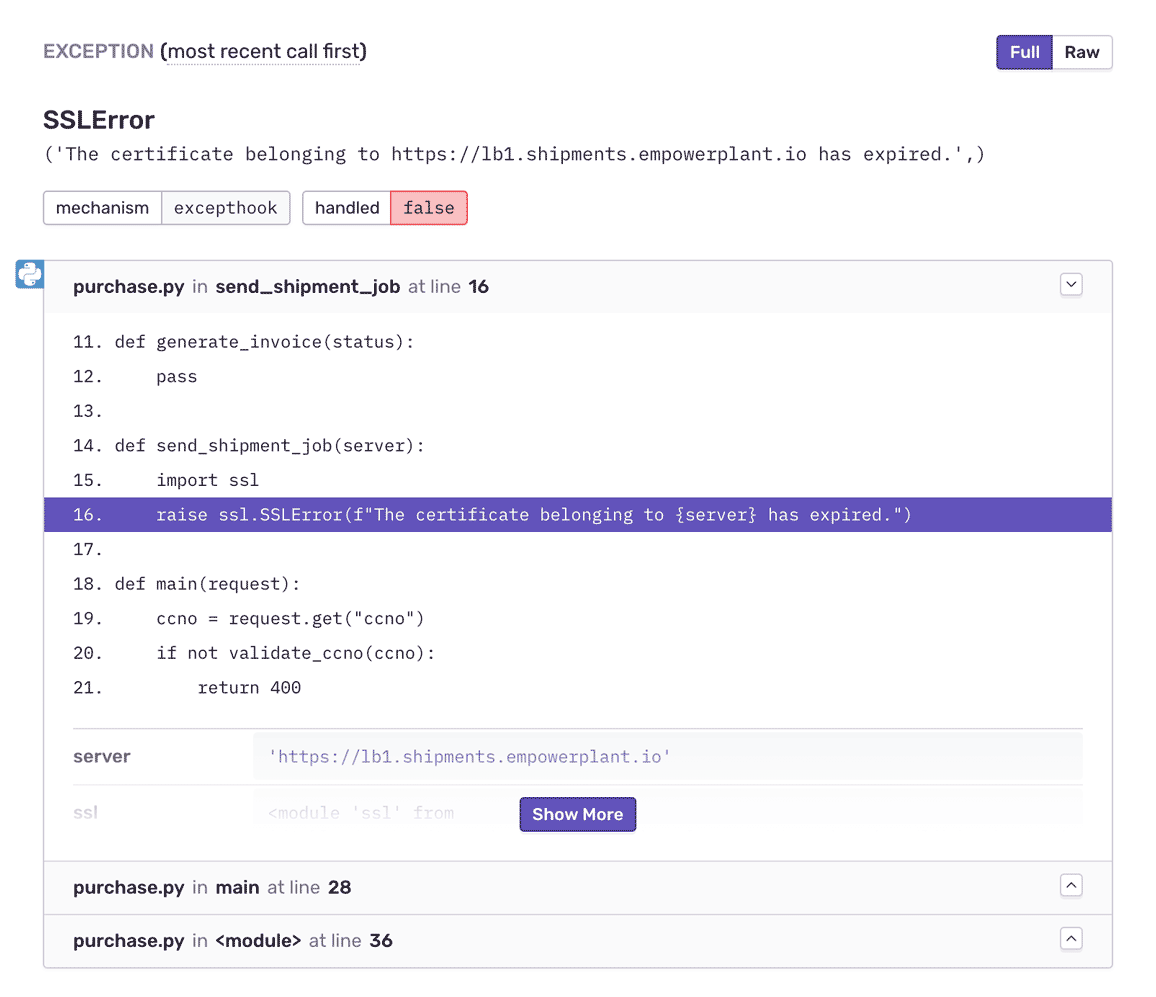
See local variables in the stack for prod errors, just like in your dev environment. Introspect more deeply into the runtime and jump into the frame to get additional data for any local variable. Filter and group Python exceptions intuitively to eliminate noise, whether you're doing Flask error handling, tracking Django views, or monitoring Celery jobs.
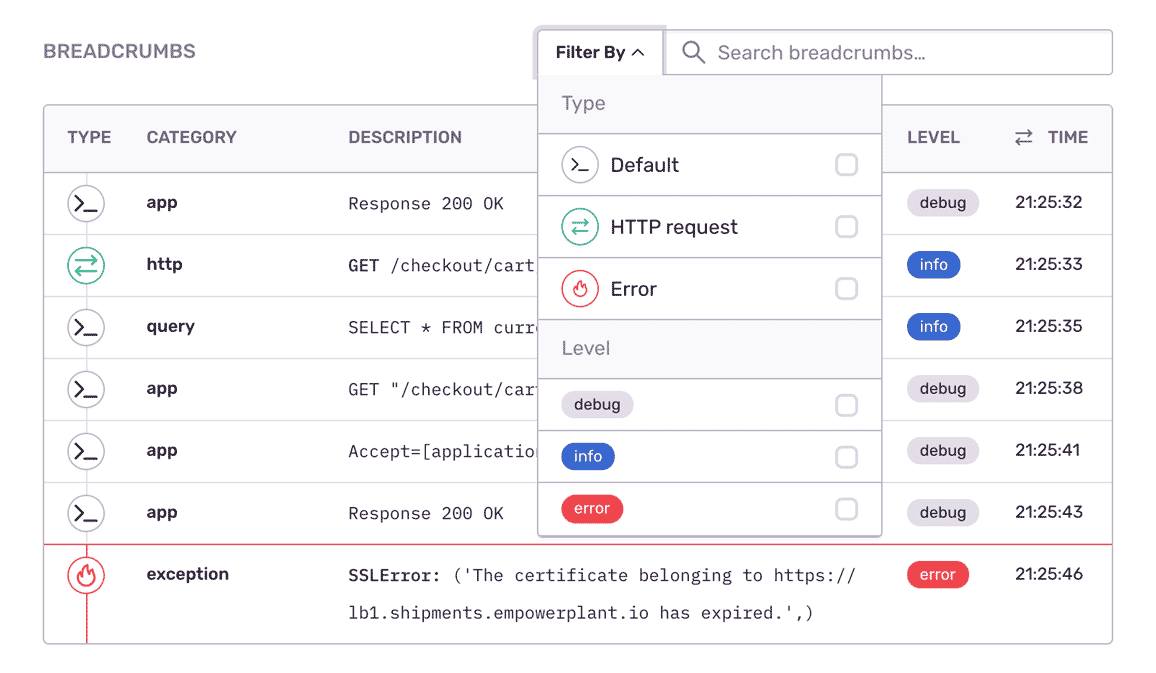
Expose the important events that led to each Python exception: SQL queries, debug logs, network requests, past errors. Improve debugging workflow with a full view of releases so you can mark errors as resolved and prioritize live issues.
Profiling lets you see what parts of your code are consuming the most resources, like CPU or memory, in your application— so you can optimize them before end user experience is impacted. Test your application performance in any environment, including in production, without writing manual tests or extensive troubleshooting.
Ship your Python logging output to Sentry and query it next to the trace that produced it. The logging calls you already write become searchable context on the exact request that failed, so retries, third-party API failures, and internal state are visible without a second tool.
"The time to resolve errors went from days to minutes."
See the Full Picture of Any Exception
Aggregate errors by details like HTTP request, hostname, and app version to see what's new, a priority, or a trend.
Assign custom tags to reproduce the error environment specific to your application, business, and users.
Answer the most important questions: In which app release did the Python bug occur? Was it the kraken?
FAQs
Traditional logging provides you with a trail of events. Some of those events are errors, but many times they're simply informational. Sentry is fundamentally different because we focus on exceptions, or in other words, we capture application crashes. We discuss in more detail here and on our blog.
Sentry supports every major language, framework, and library. You can browse each of them here.
You can get started for free. Pricing depends on the number of monthly events, transactions, and attachments that you send Sentry. For more details, visit our pricing page.
Sentry doesn't impact a web site's performance.
If you look at the configuration options for when you initialize Sentry in your code, you'll see there's nothing regarding minimizing its impact on your app's performance. This is because our team of SDK engineers already developed Sentry with this in mind.
Sentry is a listener/handler for errors that asynchronously sends out the error/event to Sentry.io. This is non-blocking. The error/event only goes out if this is an error.
Global handlers have almost no impact as well, as they are native APIs provided by the browsers.
Yes. Sentry Logs lets you send, view, and query structured logs from your application alongside your errors and traces. Because logs sit next to the error and the trace that produced them, you get the granular context — retries, API failures, internal state — that spans and stack traces alone can miss, without switching tools.
Seer is Sentry's AI debugging agent. It reads the full context Sentry already has — the error, its stack trace, the surrounding trace, logs, and profiles — to find the root cause of an issue and propose a fix. Seer can open a pull request with that fix or hand the work to an external coding agent.
You are visitor 01402503 — GeezerVison does not store the pages you look up. Best viewed with Netscape Navigator 4.7 or Internet Explorer 6 at 800×600. No cookies required.