GeezerVisonThe World Wide Web, restored to 800 pixels of glory. | ||||||||||||||||||
| Home|About|Gaming cabinet|Archives|How it works|Starter sites | ||||||||||||||||||
GeezerVison is showing vanhunteradams.com — Spectrogram Audio Spectrogram¶ECE 4760, Spring 2021, Adams/Land¶In [17]:
HTML('''<script>
code_show=true;
function code_toggle() {
 if (code_show){
 $('div.input').hide();
 } else {
 $('div.input').show();
 }
 code_show = !code_show
}
$( document ).ready(code_toggle);
</script>
<form action="javascript:code_toggle()"><input type="submit" value="Click here to toggle on/off the raw code."></form>''')
Out[17]:
In [18]:
import numpy
import matplotlib.pyplot as plt
from IPython.display import Audio
from IPython.display import Image
from scipy import signal
from scipy.fft import fftshift
from scipy.io import wavfile
plt.rcParams['figure.figsize'] = [12, 3]
from IPython.core.display import HTML
HTML("""
<style>
.output_png {
    display: table-cell;
    text-align: center;
    vertical-align: middle;
}
</style>
""")
Out[18]:
Webpage table of contents¶Background and Introduction¶In this lab, we will create a realtime audio spectrogram. A spectrogram provides a visual time-history for the frequency content of a signal. They are extremely interesting in that they provide us with a way to look at sounds (and other signals) in a way that our brains can comprehend. We will use an ADC on the PIC32 to sample an audio signal (your own voice, your favorite song, animal calls, etc.), the PIC32 will compute the FFT for that signal, and the output will be displayed on the TFT. In particular, you will associate each pixel in a row or column of the TFT display to a particular range of frequencies, and you will color the pixels in that row according to the magnitude of the FFT output at those frequencies. By coloring each row/column sequentially, you create a visual time history for the frequencies contained in that audio signal. See the two examples immediately below, and the rest of the examples at the end of this webpage. Through a Python user interface, the user may specify the range of frequencies that he/she would like represented on the spectrogram, and the PIC32 will change the sample rate in order to achieve that range of frequencies. It will also redraw the axis labels shown on the left side of the TFT display in the two examples below. Mathematical Considerations¶Nyquist sampling¶Sound is fundamentally continuous. We will use the ADC to discretely sample this continous signal. The rate at which we sample the audio determines the frequencies which we can recover for our spectrogram. The faster we sample, the higher the frequencies that we can recover. This is rigorously described by the Nyquist-Shannon sampling theorem, which, to quote the first line of the linked Wikipedia article, "acts as the fundamental bridge between continous-time signals and discrete-time signals." It states that one must sample a continuous signal at $2B$ hertz in order to recover frequencies as high as $B$ Hz. So, if you want to represent frequencies as high as 5kHz in your spectrogram, you must sample the audio signal at at least 10kHz. You will use the Nyquist-Shannon sampling theorem to build your interrupt timer (i.e. how many CPU cycles should there be between ADC samples?). The FFT¶We would like to convert a discrete-time audio signal of a finite number of points, $N$, to a discrete number of $N$ frequency signals. In order to accomplish this, we will compute the Discrete Fourier Transform (DFT) of the audio samples. Note that these samples are purely real-valued. In particular, we are going to compute the Fast Fourier Transform (FFT) of the audio signal. The linked wikipedia article provides extensive background on these algorithms. You needn't code this from scratch. This example code includes an FFTfix function which computes the FFT of two fixed-point input arrays. This particular example uses void FFTfix(_Accum fr[], _Accum fi[], int m) //Adapted from code by: //Tom Roberts 11/8/89 and Malcolm Slaney 12/15/94 [email protected] //fr[n],fi[n] are real,imaginary arrays, INPUT AND RESULT. //size of data = 2**m // This routine does foward transform only begin int mr,nn,i,j,L,k,istep, n; _Accum qr,qi,tr,ti,wr,wi; mr = 0; n = 1<<m; //number of points nn = n - 1; /* decimation in time - re-order data */ for(m=1; m<=nn; ++m) begin L = n; do L >>= 1; while(mr+L > nn); mr = (mr & (L-1)) + L; if(mr <= m) continue; tr = fr[m]; fr[m] = fr[mr]; fr[mr] = tr; //ti = fi[m]; //for real inputs, don't need this //fi[m] = fi[mr]; //fi[mr] = ti; end L = 1; k = LOG2_N_WAVE-1; while(L < n) begin istep = L << 1; for(m=0; m<L; ++m) begin j = m << k; wr = Sinewave[j+N_WAVE/4]; wi = -Sinewave[j]; //wr >>= 1; do need if scale table //wi >>= 1; for(i=m; i<n; i+=istep) begin j = i + L; tr = (wr*fr[j]) - (wi*fi[j]); ti = (wr*fi[j]) + (wi*fr[j]); qr = fr[i] >> 1; qi = fi[i] >> 1; fr[j] = qr - tr; fi[j] = qi - ti; fr[i] = qr + tr; fi[i] = qi + ti; end end --k; L = istep; end end Hann window¶Before computing the FFT, we must apply a window function to the sampled audio data. The FFT assumes that the signal on which it is operating is periodic over the entire sampling window. This is, of course, not the case. If we were to blindly apply the FFT to our raw audio samples, we'd find that we would get significant high-frequency components in the output of our FFT. The solution is to apply a window function. There are lots of these, many of which are listed in the wikipedia article linked directly above, and each of which with different frequency characteristics. A nice choice is a Hann window, given by the equation below:
\begin{align}
w[n] = 0.5\left[1 - \cos{\frac{2\pi n}{N}}\right]
\end{align}
where $N$ is the number of samples in the window (a power of 2), and $n\leq N$ is the particular index in that window. So, for a 512-sample window, this equation looks like the following:
\begin{align}
w[n] = 0.5\left[1 - \cos{\frac{2\pi n}{512}}\right]
\end{align}
After we gather 512 audio samples, which multiply each sample by the corresponding value in the Hann window before performing the FFT algorithm. This zeros the samples at the extremes of the array, making the signal periodic over the sample window. Here's what this looks like visually. Suppose we start with these raw audio samples: In [20]:
raw =   (numpy.sin((2*numpy.pi*numpy.linspace(0, 511, 512))/128) +
         numpy.sin((2*numpy.pi*numpy.linspace(0, 511, 512))/32)  +
         numpy.sin((2*numpy.pi*numpy.linspace(0, 511, 512))/64) + 2.5)*0.7
plt.plot(raw)
plt.title('Raw Audio')
plt.xlabel('Sample number')
plt.ylabel('Amplitude')
plt.show()
We multiply each raw sample by the corresponding sample in the Hann window: In [21]:
Hann = 0.5*(1-numpy.cos((2*numpy.pi*numpy.linspace(0, 511, 512))/512))
plt.plot(Hann)
plt.title('Hann window');
plt.xlabel('Sample number')
plt.ylabel('Amplitude')
plt.show()
And the result looks like this: In [22]:
plt.plot(Hann*raw)
plt.title('Windowed audio samples')
plt.xlabel('Sample number')
plt.ylabel('Amplitude')
plt.show()
Alpha Max Beta Min Algorithm¶The output from the FFT is a collection of complex numbers that have both real parts and imaginary parts. In the spectrogram, we just want to display information related to the magnitude of these complex numbers. To compute this value precisely, we would compute the square root of the sum of squares of the real/imaginary parts of each complex number. This, however, is computationally expensive. The alpha max beta min algorithm provides a shortcut which is accurate to within about 4% (good enough for us) and is less expensive.
Hardware¶Biased high-pass filter¶The audio output voltage is in the range -2V to 2V. We must bias/scale this to the range 0-3.3V for sampling by the ADC. We can do this with a biasing high-pass filter as shown below. 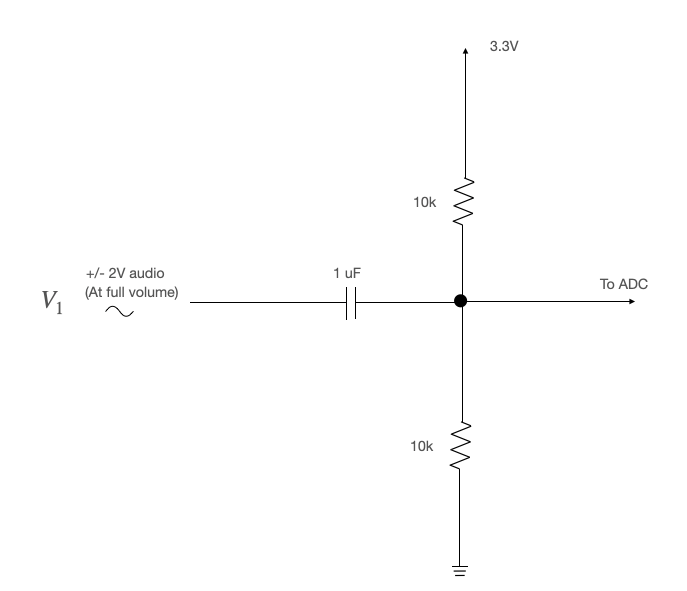
Note: If you aren't seeing anything on your spectrogram, check the audio input with the oscilloscope. Make sure the volume isn't turned down. Connections to PIC32
Program organization¶Here is a suggestion for how to organize your program:
Weekly checkpoints and lab report¶Note that these checkpoints are cumulative. In week 2, for example, you must have also completed all of the requirements from week 1. Week one required checkpoint¶By the end of lab section in week one you must have:
Week two assignment¶Timing of all functions in this lab, and in every exercise in this course will be handled by interrupt-driven counters, not by software wait-loops. ProtoThreads maintains an ISR driven timer for you. This will be enforced because wait-loops are hard to debug and tend to limit multitasking Write a Protothreads C program which will:
Write a Python program which will:
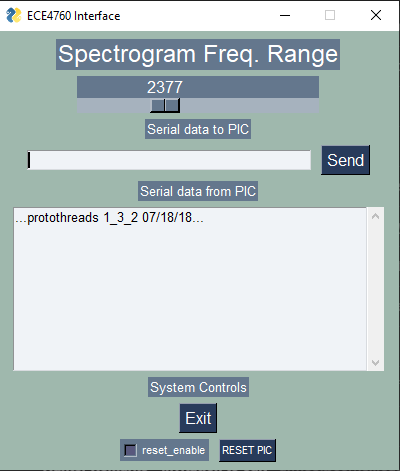
You will be asked to demo your program with an online pure tone generator like this one, and with any other audio of your choice. This might be your own voice, a song, animal calls, or anything else you think is interesting. At no time during the demo can you reset or reprogram the MCU. Lab report¶Your written lab report should include the sections mentioned in the policy page, and:
Example of working system¶In [ ]:
| ||||||||||||||||||
| You are visitor 01402503 — GeezerVison does not store the pages you look up. Best viewed with Netscape Navigator 4.7 or Internet Explorer 6 at 800×600. No cookies required. |