GeezerVisonThe World Wide Web, restored to 800 pixels of glory. |
| Home|About|Gaming cabinet|Archives|How it works|Starter sites |
GeezerVison is showing d3-graph-gallery.com — Area Chart | the D3 Graph Gallery Step by step
Template
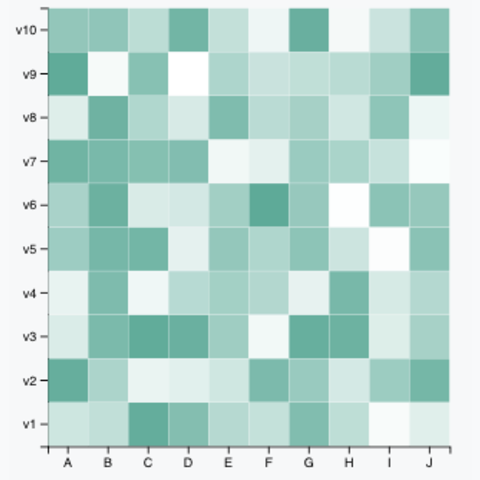
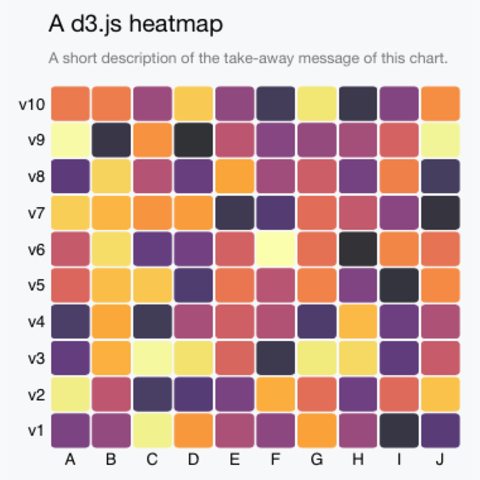
The following heatmap is my starting template for my personal work. It offers most of the feature you need for a good heatmap: colorBrewer colorscale, hover effect, tooltip, title and custom axis. The input dataset has 3 columns: row, column and value. Get the code here. Related chart types 
Scatter

Heatmap

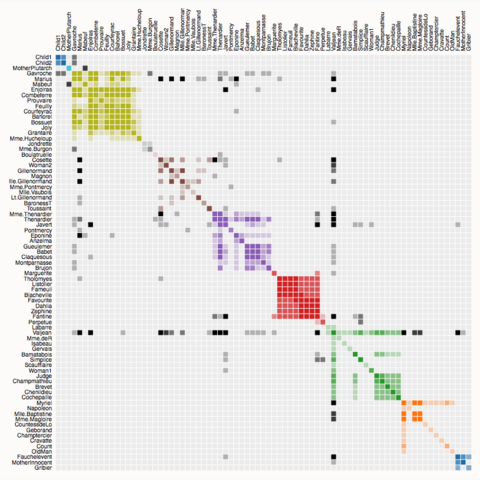
Correlogram

Bubble
Connected scatter
Density 2d
|
| You are visitor 01402503 — GeezerVison does not store the pages you look up. Best viewed with Netscape Navigator 4.7 or Internet Explorer 6 at 800×600. No cookies required. |