The ClimateChart application shows the climate,
i.e. the temperature and the precipitation, of all places on Earth.
When you click on the world map above, a climate chart is generated.
On the left side of each chart you can switch between the Walter-Lieth Chart,
a Distribution Plot and a color-coded Data Table.
You can also change the time period and the source of the climate data.
For the last generated climate chart you also have the possibility to change or add the title.
In case you are using the diagrams or parts of it within scientific or other publications, we recommend to cite:
Laura Zepner, Pierre Karrasch, Felix Wiemann & Lars Bernard (2020) ClimateCharts.net – an interactive climate analysis web platform, International Journal of Digital Earth,
DOI: 10.1080/17538947.2020.1829112
How to use ClimateCharts.net
ClimateCharts.net is an easy to use web application for the generation of Walter-Lieth climate charts.
The individual functions of the application are briefly explained below:
1 Creating a Climate Chart
1.1 Map
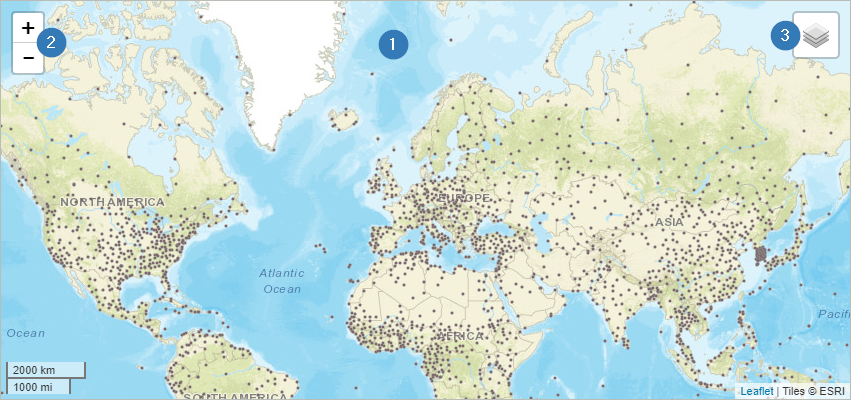
When the web application is started, a map (1) is available that allows the user to select a region
for generating a climate diagram. The most common tools are available for this purpose:
Mouse interaction – scroll wheel: zoom in/out
+/-: zoom in/out (2)
Select Base Map (3)
ESRI Base Map
OpenStreetMap
1.2 Select a Location
The selection of a location is quite easy and is done by clicking on a position in the map. Basically,
there are two types of data sets available - raster data (see 1.2.1) and station data (see 1.2.2).
In addition, it is also possible to select a position on the map by entering coordinates into the filter menu.
You can find it under the map tile (1). In this case a raster cell at this position is selected.
1.2.1 Raster Data
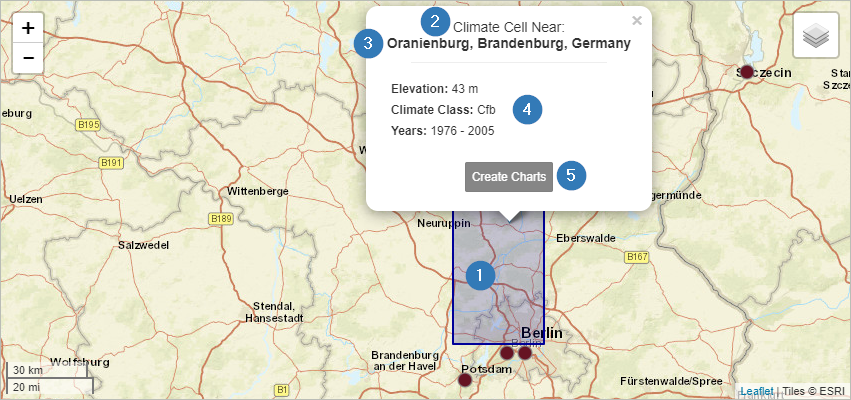
Once you selected a raster data set and clicked on a location, the corresponding raster cell is shown on the
map in blue (1). Within this grid cell the resulting climate diagrams are identical. Another indicator that you
are seeing raster instead of station data is the note "Climate Cell" at the top of the information popup (2).
This popup also contains information about the name of the place you have selected (3) as well as information
about the climate classes according to Köppen-Geiger, the altitude and the selected time period (4). With the
button "Create Charts" a diagram is created below the map (5).
1.2.2 Station Data
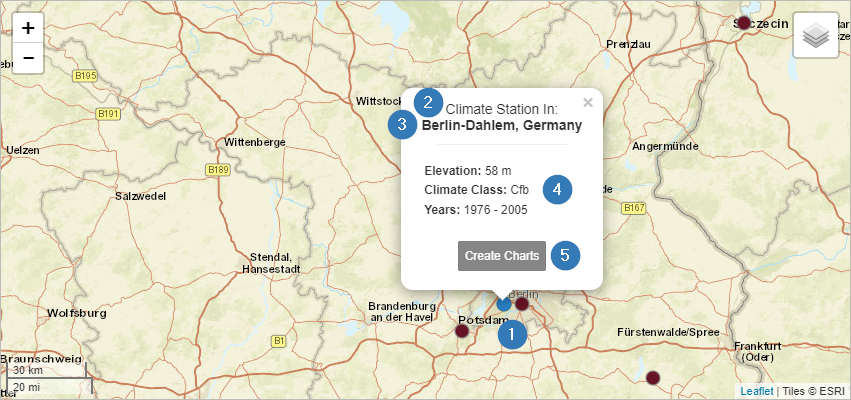
If you click on one of the brown marked dots on the map, a weather station is selected. Once activated the
color will change to blue (1).
You can also see that you have selected a station by the note "Climate Station" in the popup (2). This popup also
contains information about the name of the place you have selected (3) as well as information about the climate
classes according to Köppen-Geiger, the altitude and the selected time period (4). With the button "Create Charts"
a diagram is created below the map (5).
1.3 Filter Options
1.3.1 Data Sets
Overall, four data sets are available for the generation of climate charts.
The weather stations’ data set is part of the Global Historical Climatology Network (GHCN).
This data set is automatically selected whenever a user clicks on a station (cf. 1.2.2).
In addition, three different raster data sets can be used to generate climate diagrams. Select
one of these data sets before clicking on a location in the map. The selection menu is located beneath the map.
After you have chosen the preferred data set, you can select a location in the map.
You can find more information about the datasets in the menu "Datasets & Software".
1.3.2 Time Period
Climate diagrams are often generated for a period of at least 30 years. The web application
ClimateCharts.net offers the possibility to adapt this period according to your own requirements.
For this purpose, a slider for adjusting the period (1) is available. The Dark grey area shows the
maximum time period in which data (independent of the selected dataset) is available. The maximum
available time period for the selected data set (2) is shown in white. The length of this bar can
vary depending on the selected data set. The selected time period can be adjusted individually by moving
the upper and lower limits (3) of the light grey bar.
Only the data of the selected period is processed and displayed in the climate chart. The "Reset"
button is used to set the most recent time period with a length of 30 years (4).
2 Visualizations
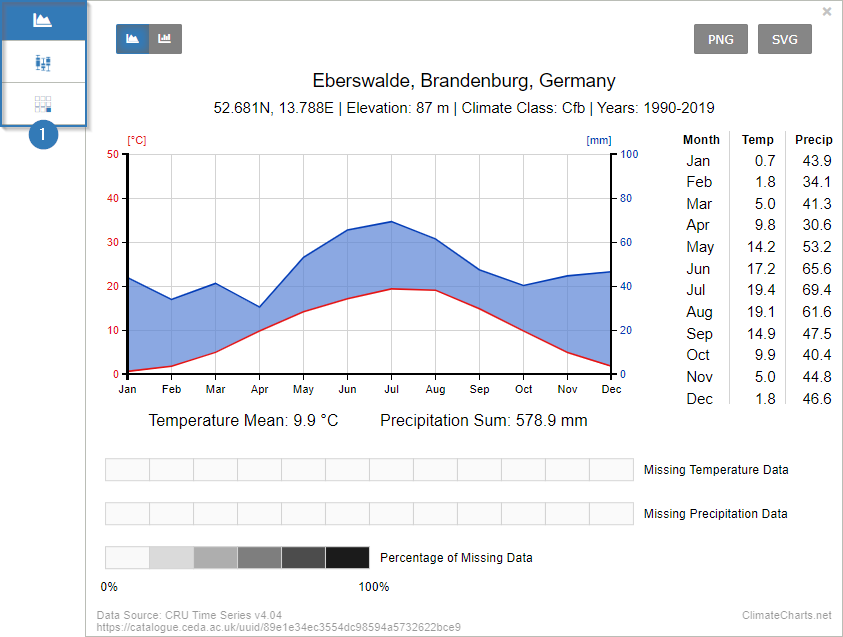
Currently, three different types of climate charts can be generated. After you have created a
climate chart with the button "Create Chart" you will get the following view:
In the upper left corner (1) you can switch between the three different visualizations.
Walther-Lieth Climate Chart (see 2.1)
Distribution Chart (see 2.2)
Availability Chart (see 2.3)
In the default setting, the Walter-Lieth Chart is displayed after generation.
2.1 Walter-Lieth Climate Chart
2.1.1 Structure of the Walter-Lieth Chart
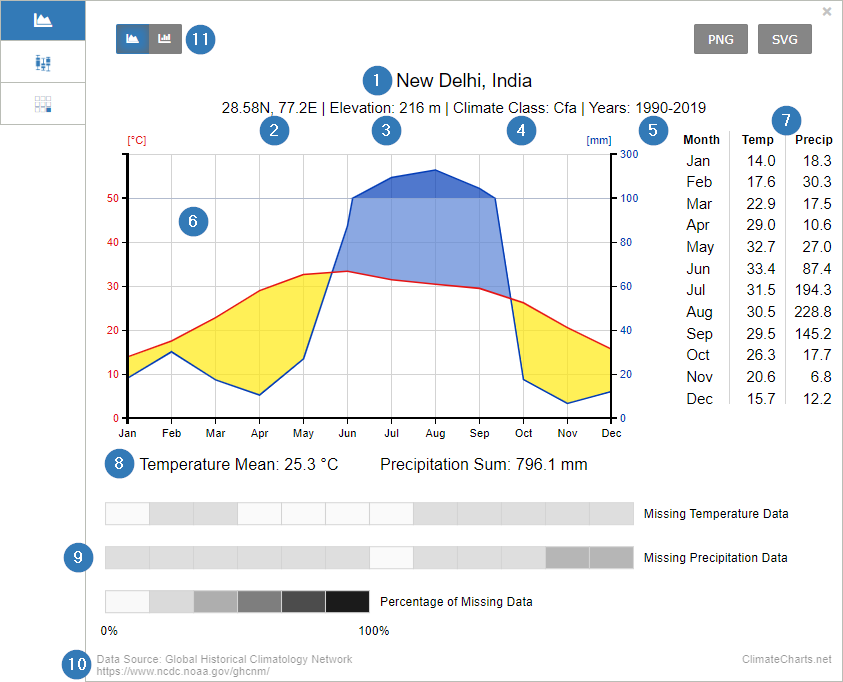
The Walter-Lieth Chart contains a number of components, which will be explained in the following:
The location’s name. A gazetteer is used to generate the name (https://www.geonames.org/). Alternatively, you can set a name manually.
The location’s coordinates.
Elevation of the location. For this information, the gazetteer "Geonames" is used as well.
Köppen-Geiger Climate Class. (Markus Kottek, Jürgen Grieser, Christoph Beck, Bruno Rudolf and Franz Rubel. 2006. "World Map of the Köppen-Geiger climate classification updated." Meteorologische Zeitschrift 15 (3): 259–263. https://dx.doi.org/10.1127/0941-2948/2006/0130.)
Selected time period
Visualization of climate data according to Walter-Lieth (1967)
Table of the average monthly values used for temperature and precipitation sums.
Mean annual temperature and annual precipitation values
Information on the completeness of the data within the selected time period
Data source (see 1.3.1)
Option to display a bar chart
2.1.2 Understanding the Walter-Lieth Chart
The Walter-Lieth Chart is an easy way to show information about the climatic conditions at a selected location
The chart visualizes mean monthly temperatures (1) and mean monthly precipitation sum values (2). The values
temperature and precipitation have a ratio of 1:2 up to a value of 100 mm mean monthly precipitation. This ratio
changes to 1:10 if precipitation exceeds 100 mm.
The resulting intersections between the temperature and precipitation curves create areas of different classifications (color):
Yellow: The temperature curve lies above the precipitation curve. Arid or semi-arid conditions prevail.
Light blue: The precipitation curve lies above the temperature curve. Humid conditions prevail.
Dark blue: The precipitation curve is clearly above the temperature curve (note change in the scaling of the precipitation axis). These conditions are also called per-humid (monthly precipitation sum > 100 mm).
2.2 Distribution Chart (Boxplot)
2.2.1 Structure of the Distribution Chart
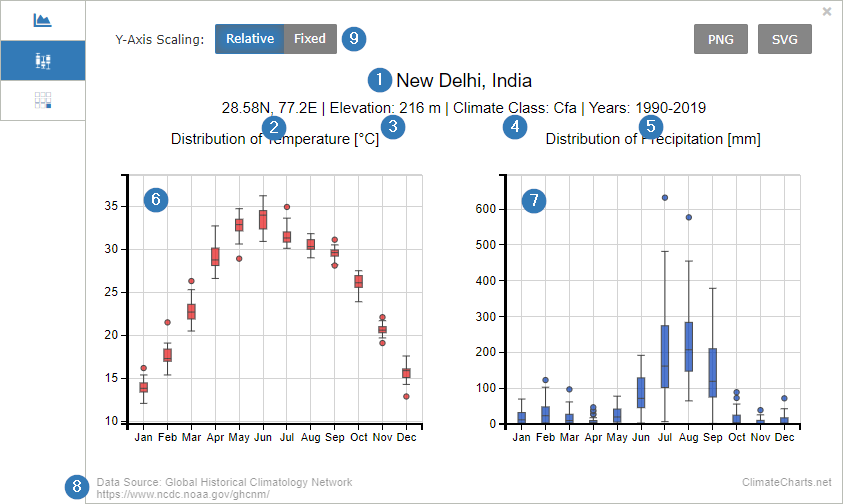
The location’s name. A gazetteer is used to generate the name (https://www.geonames.org/). Alternatively, you can set a name manually.
The location’s coordinates.
Elevation of the location. For this information, the gazetteer "Geonames" is used as well.
Köppen-Geiger Climate Class. (Markus Kottek, Jürgen Grieser, Christoph Beck, Bruno Rudolf and Franz Rubel. 2006. "World Map of the Köppen-Geiger climate classification updated." Meteorologische Zeitschrift 15 (3): 259–263. https://dx.doi.org/10.1127/0941-2948/2006/0130.)
Selected time period
Distribution chart (box plot) for the mean monthly temperatures during the selected period
Distribution chart (box plot) for the monthly precipitation sums during the selected period
Data source (see 1.3.1)
Adjustment of the scaling of the y-axis.
Relative = based on the selected data
Fixed = based on all data sets
2.2.2 Understanding the Distribution Chart
This chart visualizes the monthly distribution of the climate parameters included in the Walter-Lieth Chart
using a box plot. This kind of chart visualizes the distribution of different parameters. Here, the average
sums of monthly temperature and precipitation values are shown. The box plot include:
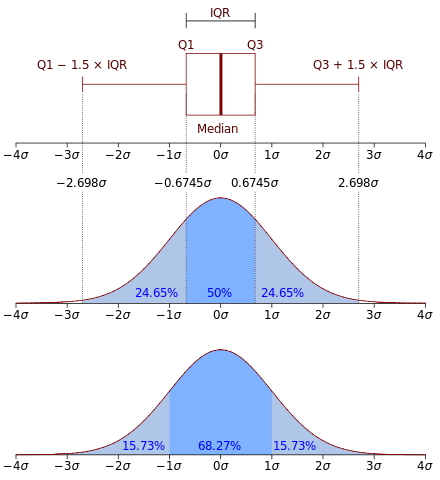
Median (middle value of the data set)
First quartile (25th Percentile, Q1)
Third Quartile (75th Percentile, Q2)
Interquartile Range (IQR, 25th to the 75th percentile; Box)
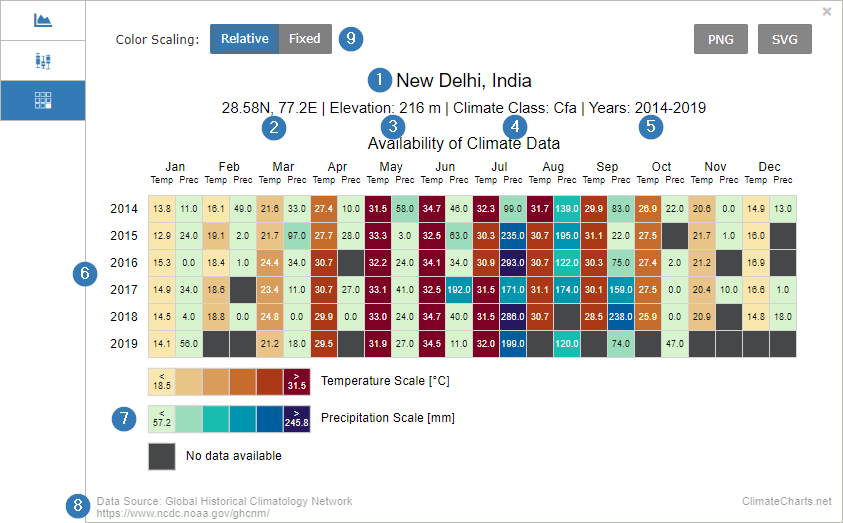
The Availability Chart is a detailed tabular representation of the data of the Walter Lieth Climate Chart.
The location’s name. A gazetteer is used to generate the name (https://www.geonames.org/). Alternatively, you can set a name manually.
The location’s coordinates.
Elevation of the location. For this information, the gazetteer "Geonames" is used as well.
Köppen-Geiger Climate Class. (Markus Kottek, Jürgen Grieser, Christoph Beck, Bruno Rudolf and Franz Rubel. 2006. "World Map of the Köppen-Geiger climate classification updated." Meteorologische Zeitschrift 15 (3): 259–263. https://dx.doi.org/10.1127/0941-2948/2006/0130.)
Selected time period
Visualization of the mean monthly temperature values and the monthly precipitation sums involved in the climate diagram.
Color-coded scales for temperature and precipitation.
Data source (see 1.3.1)
Adjustment of the color-coded scales.
Relative = based on the selected data
Fixed =
Temperature: < 5°C to > 35°C
Precipitation: < 40 mm to > 200 mm
2.3.2 Understanding the Availability Chart
The Availability Chart is an easy-to-understand instrument for displaying temperature and precipitation data as numerical values.
The color-coding of the table cells allows you to quickly perceive the values. It allows the comparison of the monthly
values over the selected time period. It is also possible to identify data gaps. These data gaps occur exclusively in the
data set of the GHCN Weather Stations (see 1.3.1).
3 Download Charts
All charts of the application Climatecharts.net are available for free. In the upper right corner of each diagram you
will find two buttons to save the charts as PNG file (raster graphics) or SVG file (vector graphics). Saving as a vector
graphic also allows you to easily edit the data (e.g. coloring).
In case you are using the diagrams or parts of it within scientific or other publications, we recommend to cite:
Laura Zepner, Pierre Karrasch, Felix Wiemann & Lars Bernard (2020) ClimateCharts.net – an interactive climate analysis web platform, International Journal of Digital Earth,
DOI: 10.1080/17538947.2020.1829112
Datasets
ClimateCharts.net uses two different kinds of data sources:
interpolated and simulated climate data for raster cells on the map
real measured weather data from weather stations around the world
Climate Data for Raster Cells
Please note that the temperature and precipitation values shown in the diagram are based on
interpolated data and therefore might differ significantly from real local conditions.
Weather Stations
Global Historical Climatology Network
GHCN-Monthly provides climatological observations for four elements: monthly mean maximum
temperature, minimum temperature, mean temperature, and monthly total precipitation.
Since the early 1990s the Global Historical Climatology Network-Monthly (GHCN-M) dataset
has been an internationally recognized source of data for the study of observed variability
and change in land surface air temperature. It provides monthly mean temperature data for
7280 stations from 226 countries and territories, ongoing monthly updates of more than 2000 stations
to support monitoring of current and evolving climate conditions, and homogeneity adjustments
to remove non-climatic influences that can bias the observed temperature record.
Location Names and Elevation data
For the title and elevation value the gazetteer from GeoNames
is used (Creative Commons Attribution 3.0 License). Elevation is based on SRTM data and only available between 60° northern
and 58° southern latitude. The climate class is calculated from the temperature and precipitation data according
to the Köppen-Geiger climate classification scheme.
In case you are using the diagrams or parts of it within scientific or other publications, we recommend to cite:
Laura Zepner, Pierre Karrasch, Felix Wiemann & Lars Bernard (2020) ClimateCharts.net – an interactive climate analysis web platform, International Journal of Digital Earth,
DOI: 10.1080/17538947.2020.1829112
Matomo Webanalysis
To improve our web pages, we additionally collect anonymised visitor data using the web analysis tool Matomo (formerly PIWIK).
In order for us to provide you the best possible experience on our website, we need to collect and process certain information. Depending on your use of the Services, that may include:
Usage data — when you visit our site, we will store: the website from which you visited us from, the parts of our site you visit, the date and duration of your visit, your anonymised IP address, information from the device (device type, operating system, screen resolution, language, country you are located in, and web browser type) you used during your visit. We process this usage data for statistical purposes, to improve our site and to recognize and stop any misuse.
Cookies — we use cookies (small data files transferred onto computers or devices by sites) for record-keeping purposes and to enhance functionality on our site. You may deactivate the transmission of cookies by changing the settings of your web browser or deactivate the checkbox below. Cookies that are already stored may be deleted at any time.
This website uses cookies. Some of them are essential for the operation of the site, while others help us to
improve this site and the user experience (tracking cookies). You can decide for yourself whether you want to
allow cookies or not.
Please note that if you reject them, you may not be able to use all the functionalities of the site.
You can change your decision at any point under the "About" section.
You are visitor 01402503 — GeezerVison does not store the pages you look up. Best viewed with Netscape Navigator 4.7 or Internet Explorer 6 at 800×600. No cookies required.
 ClimateCharts.net