You can debug Dart web apps using your Dart IDE, Dart DevTools, and browser tools such as Chrome DevTools.
-
App logic and state: Use your IDE's built-in debugger or Dart DevTools
to set breakpoints in
.dartfiles, inspect variables, and evaluate Dart expressions. - DOM, CSS, and network activity: Use browser developer tools such as Chrome DevTools.
Debug in an IDE
#
The fastest way to debug a Dart web app during development is from a
Dart-enabled IDE such as VS Code or IntelliJ IDEA.
Open your project, set breakpoints in the editor margin, and start a debug
session.
The editor compiles your app with dartdevc, launches Chrome, and attaches the
debugger automatically.
To inspect source-mapped Dart files directly in Chrome DevTools at any time,
press Control+Shift+I
(Command+Option+I on macOS).
Chrome uses source maps
to display your original .dart source files
instead of compiled JavaScript or WebAssembly.
Debug from the command line with Dart DevTools
#
To debug from the command line using the latest Dart SDK and
Google Chrome, activate the webdev
CLI tool
globally with dart pub global:
$ dart pub global activate webdev
-
In your Dart web app root directory, fetch package dependencies:
$ dart pub get -
Start the development server in debug mode (optionally pass
--auto restartto hot-restart on file changes):Launch a new debug instance of Chrome:
$ webdev serve --debug --auto restartUse an existing Chrome window (requires the Dart Debug Extension):
$ webdev serve --debug-extension --auto restart
Open
http://localhost:8080in Chrome if it isn't already open.-
Open Dart DevTools:
- With
--debug, press Alt+D (Option+D on macOS). - With
--debug-extension, click the Dart icon in the Chrome toolbar.
- With
-
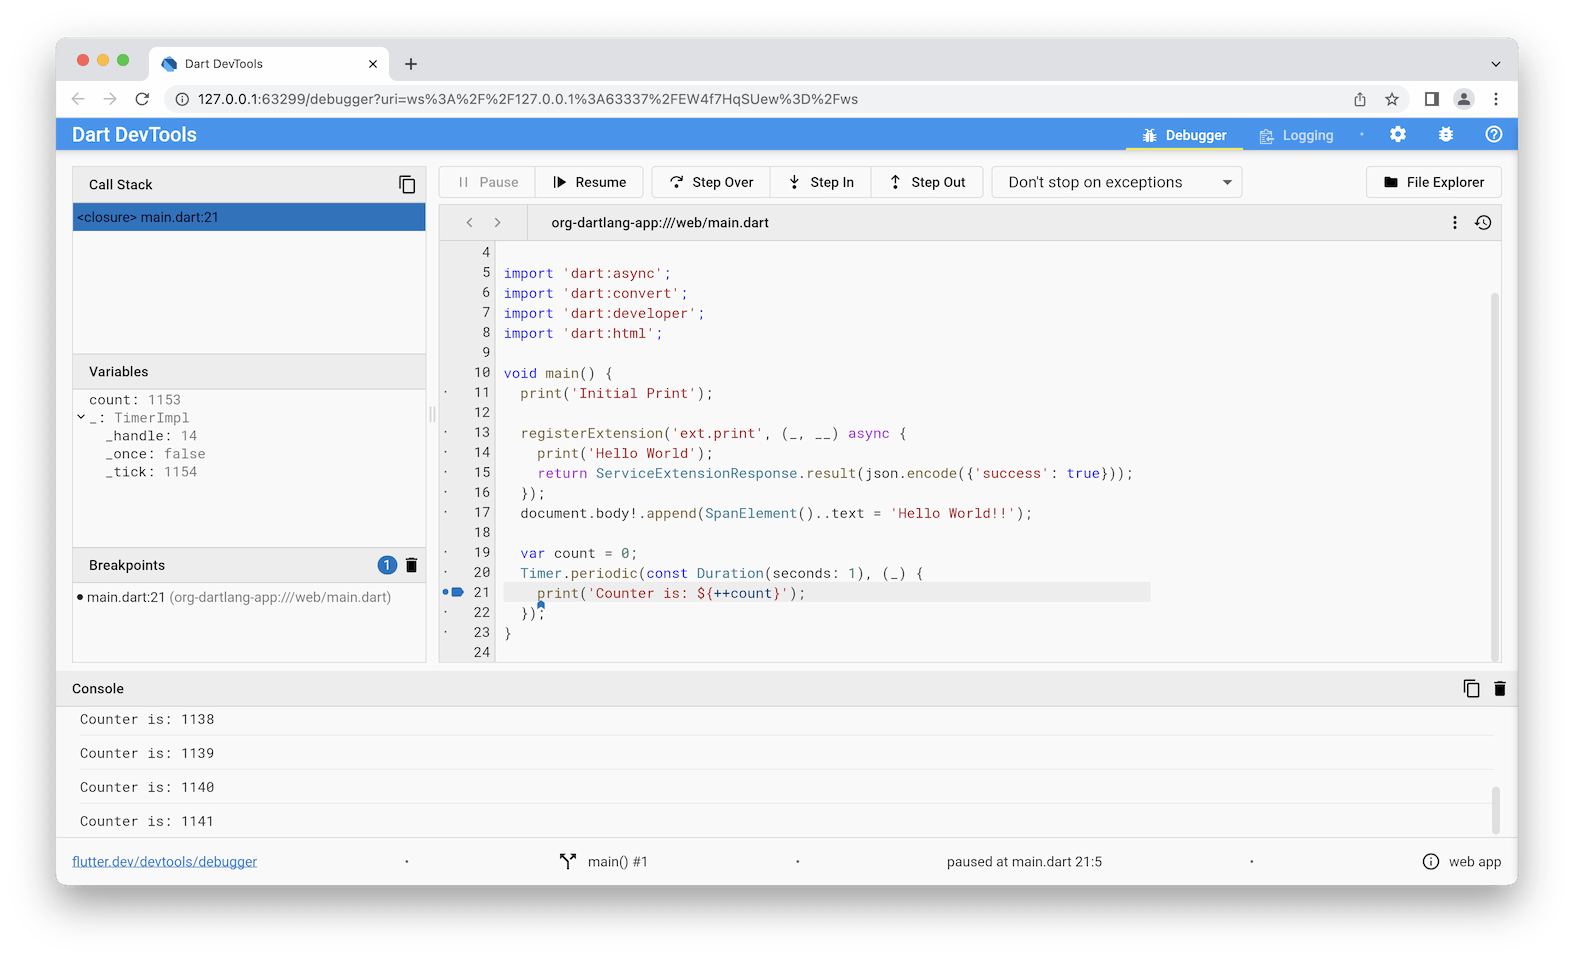
In the Debugger tab, click a line number in your
.dartfile to set a breakpoint, then trigger that code path in your app. When execution pauses, inspect variables in the Variables pane and step through code using Step In, Step Over, and Step Out. -
Open the Logging view to inspect
stdout,stderr, and system events.
Running web tests and collecting coverage
#
To run browser unit tests, pass -p (--platform) to
dart test:
$ dart test -p chrome
You can also target Firefox (-p firefox) or Safari (-p safari).
To pause execution after loading so you can open browser DevTools and set
breakpoints before your tests run, pass --pause-after-load:
$ dart test -p chrome --pause-after-load
To collect code coverage for JavaScript (dart2js) web tests in Chrome, pass
-p chrome to test_with_coverage (requires package:coverage
1.16.0 or higher):
$ dart run coverage:test_with_coverage -p chrome
Debugging production code
#
Chrome, Edge, Firefox, and Safari all support source maps for both JavaScript
(.js.map) and WebAssembly (.wasm.map) production builds.
When compiling to WebAssembly with dart compile wasm,
the compiler emits a <name>.wasm.map source map alongside <name>.wasm
and
strips static symbol names from the .wasm binary by default (and minifies
runtime type names at -O2 and higher).
Pass --no-strip-wasm to preserve human-readable static symbol names in
browser DevTools stack traces and flamecharts:
$ dart compile wasm -O2 --no-strip-wasm web/main.dart -o build/main.wasm
Ensure that your web server serves the generated .js.map or .wasm.map file
alongside the compiled output so the browser can resolve Dart source files.
Whichever browser you use, enable pausing on at least uncaught exceptions.
For frameworks such as dart:async that wrap user code in try-catch
blocks,
enable pausing on all exceptions to surface caught errors.
Chrome
#- Open Chrome DevTools.
- Confirm that source maps are enabled (on by default), as described in Map preprocessed code to source code.
- Enable pausing on all exceptions or uncaught exceptions, as described in Pause your code with breakpoints.
- Reload your app.
Edge
#- Open Microsoft Edge DevTools (F12).
- In the Sources tool, open the Breakpoints pane and enable Pause on uncaught exceptions (or Pause on caught exceptions), as described in Pause your code with breakpoints.
-
Reload your app to inspect source-mapped
.dartfiles in the Sources tool.
Firefox
#-
Open the Firefox Web Developer Tools.
-
Enable Pause on exceptions:
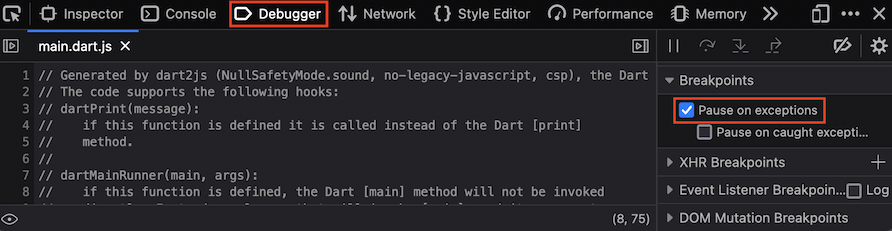
Reload your app to view source-mapped files in the Debugger tab.
Safari
#- Turn on the Develop menu, as described in Enabling Web Inspector.
- Enable breakpoints on all exceptions or uncaught exceptions—see Add a JavaScript breakpoint in Safari Developer Help.
- Reload your app.
Resources
#Unless stated otherwise, the documentation on this site reflects Dart 3.14.0. Page last updated on 2026-10-15. View source or report an issue.