Memory panel overview

The Memory panel provides diagnostic tools that let you see the memory distribution of JavaScript objects, discover and isolate memory leaks, get a breakdown of memory allocation by function, and more.
Overview
The Memory panel lets you capture four profile types. These profile types show you snapshots from different perspectives and provide varying utility:
- Heap snapshot: Shows memory distribution among your page's Javascript objects and related DOM nodes.
- Allocation instrumentation on timeline: Shows instrumented JavaScript memory allocations over time. Once a profile is recorded you can select a time interval to see objects that were allocated within it and still live by the end of the recording. Use this profile type to isolate memory leaks.
- Allocation sampling: Records memory allocations using the sampling method. This profile type has minimal performance overhead and can be used for long running operations. It provides good approximations of allocations broken down by JavaScript execution stack.
- Detached elements: Shows objects that are retained by a JavaScript reference.
You can select a JavaScript VM instance to run each of these profiles on.
To learn more, see:
Open the Memory panel
To open the Memory panel:
- Open DevTools.
- Open the Command menu by pressing:
- macOS: Command+Shift+P
- Windows, Linux, ChromeOS: Control+Shift+P
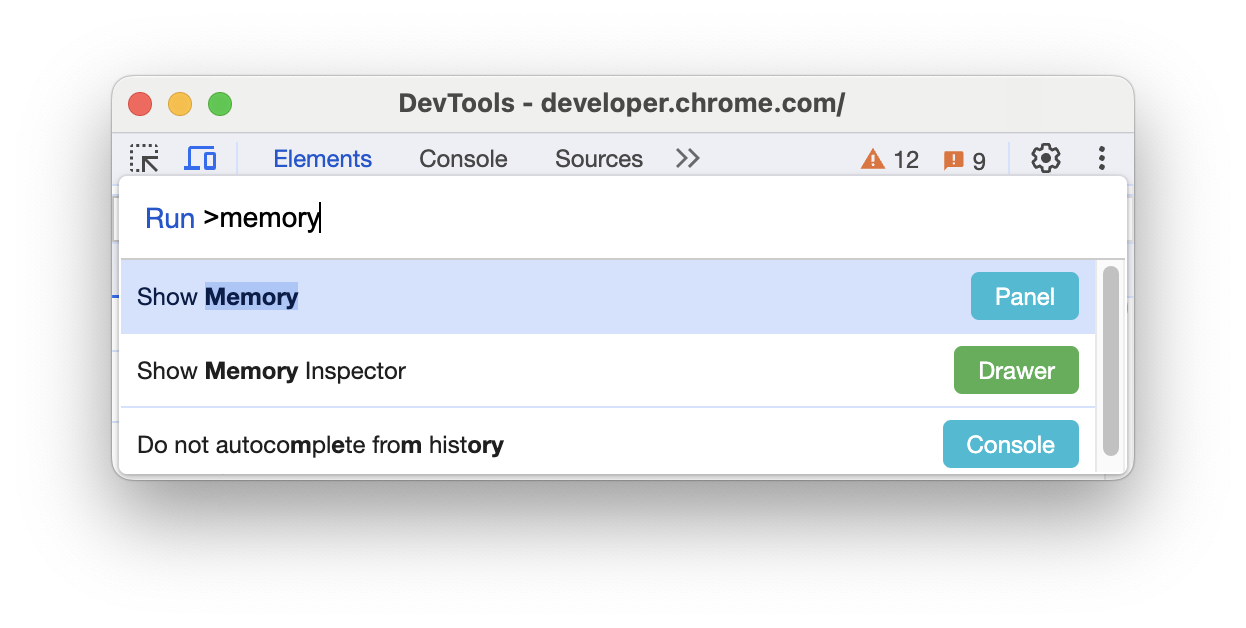
- Start typing
memory, select Show Memory, and press Enter. DevTools displays the Memory panel at the top of your DevTools window.
Alternatively, you can open the Memory panel in the following ways:
- In the action bar at the top, click double_arrow More panels and select Memory from the drop-down list.
- In the top right corner, select more_vert More options > More tools > Memory.