Consumes data points as input and plots them on a 2D graph in the Powershell console
Type of Graphs Available -
-
Scatter
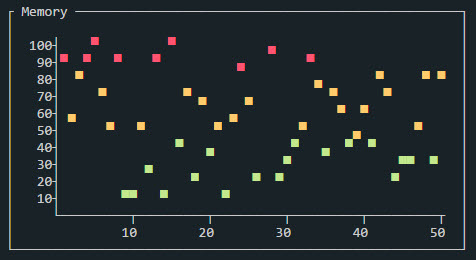
-
Bar
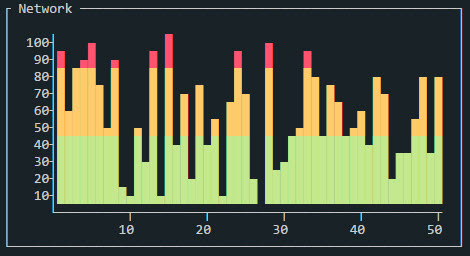
-
Line
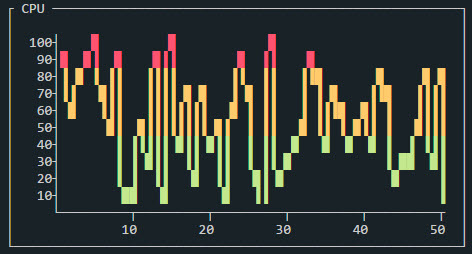


PowerShell v5 and Later
You can install the Graphical module directly from the PowerShell Gallery
- [Recommended] Install to your personal PowerShell Modules folder
Install-Module Graphical -scope CurrentUser
- [Requires Elevation] Install for Everyone (computer PowerShell Modules folder)
Install-Module Graphical
To install to your personal modules folder run:
iex (new-object System.Net.WebClient).DownloadString('https://raw.githubusercontent.com/PrateekKumarSingh/Graphical/master/Install.ps1')
- Color-coded output depending upon the Value of data point
- Colors codes can be customized by passing a color-map hash table
- Custom X an Y-Axis labels
- Graph in console is independent and fully customizable, not like Task Manager (Performance Tab)
- Could be incorporated in Powershell scripts
- Can consume data points generated during script run or Pre stored data like in a file or database.
- Independent of PowerShell version, and Works on PowerShell Core (Windows\Linux)
-
The function
Show-Graphtakes data points as input and plot them on a 2D graph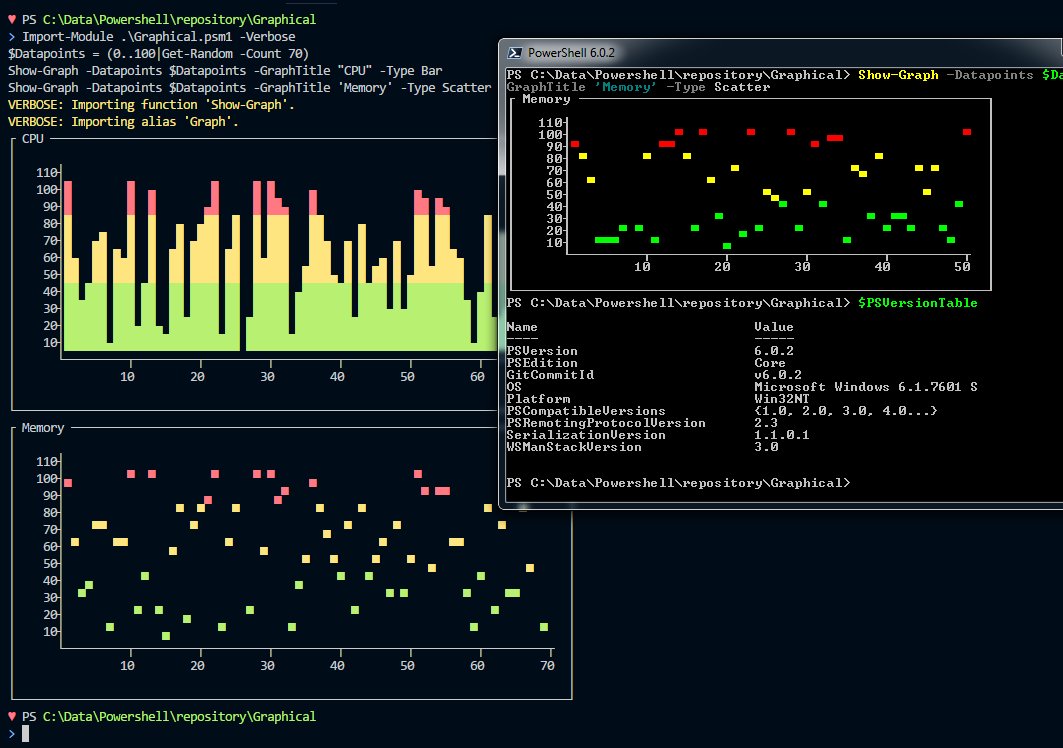
You can also customize the labels on X and Y-Axis and provide a graph title
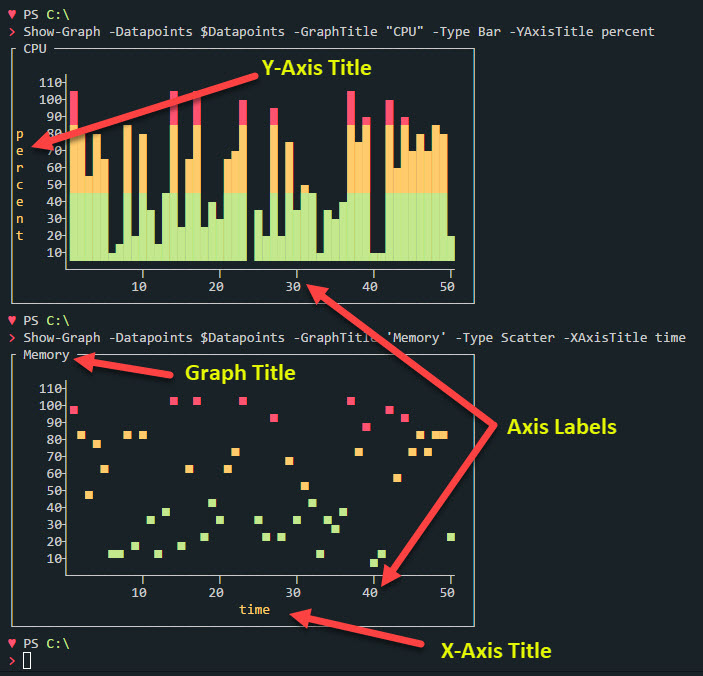
The function
Show-Graphcan consume data points, generated during script execution or from a file or database like in the above example.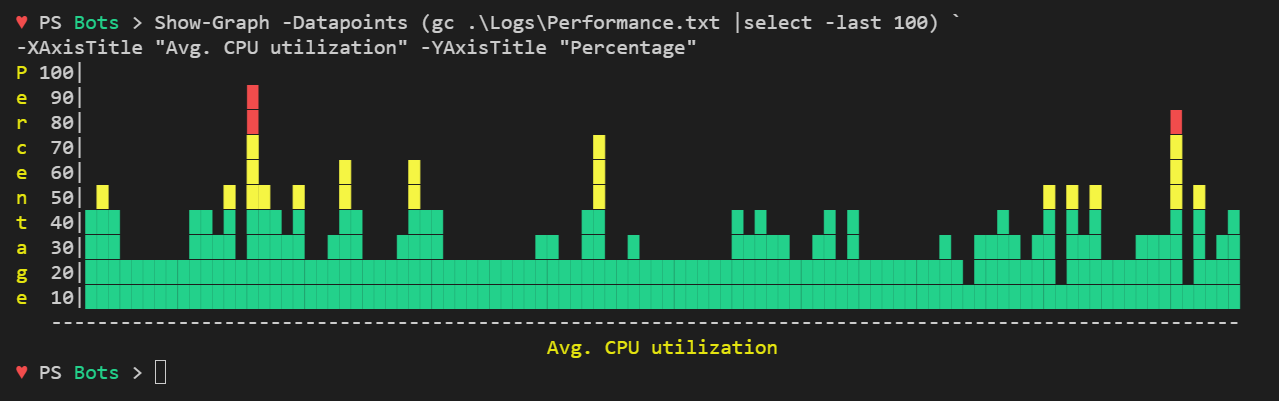
-
Plotting Audio Peak Levels in your PowerShell Console (Don't forget to play some audio! :P)
Install-Module AudioDeviceCmdlets, Graphical
Import-Module AudioDeviceCmdlets, Graphical -Verbose
$Device = Get-AudioDevice -Playback
[int[]]$datapoints =@(0)*50
do {
    $PeakValue = $Device.Device.AudioMeterInformation.MasterPeakValue*100
    $datapoints += [int]$PeakValue
    $datapoints = $datapoints | Select-Object -last 50
    Clear-Host
    Show-Graph -datapoints $datapoints -GraphTitle AudioLevels
    Show-Graph -datapoints $datapoints -GraphTitle AudioLevels -Type Line
    Show-Graph -datapoints $datapoints -GraphTitle AudioLevels -Type Scatter
    Start-Sleep -Milliseconds 1000
} while ($true)

-
Visualizing Azure Monitor Metrics like CPU %age on a Virtual machine in #PowerShell


```PowerShell
$ResourceID = '/subscriptions/<subscription>/resourceGroups/demo-resource-group/providers/Microsoft.Compute/virtualMachines/SimpleWinVM'
$Data = Get-AzMetric -ResourceId $ResourceID  -WarningAction SilentlyContinue | Select-Object unit, data
$Datpoints = $data.data.average.foreach({[int]$_})

Import-Module Graphical
Show-Graph -Datapoints $Datpoints -GraphTitle 'CPU (% age)'

```
