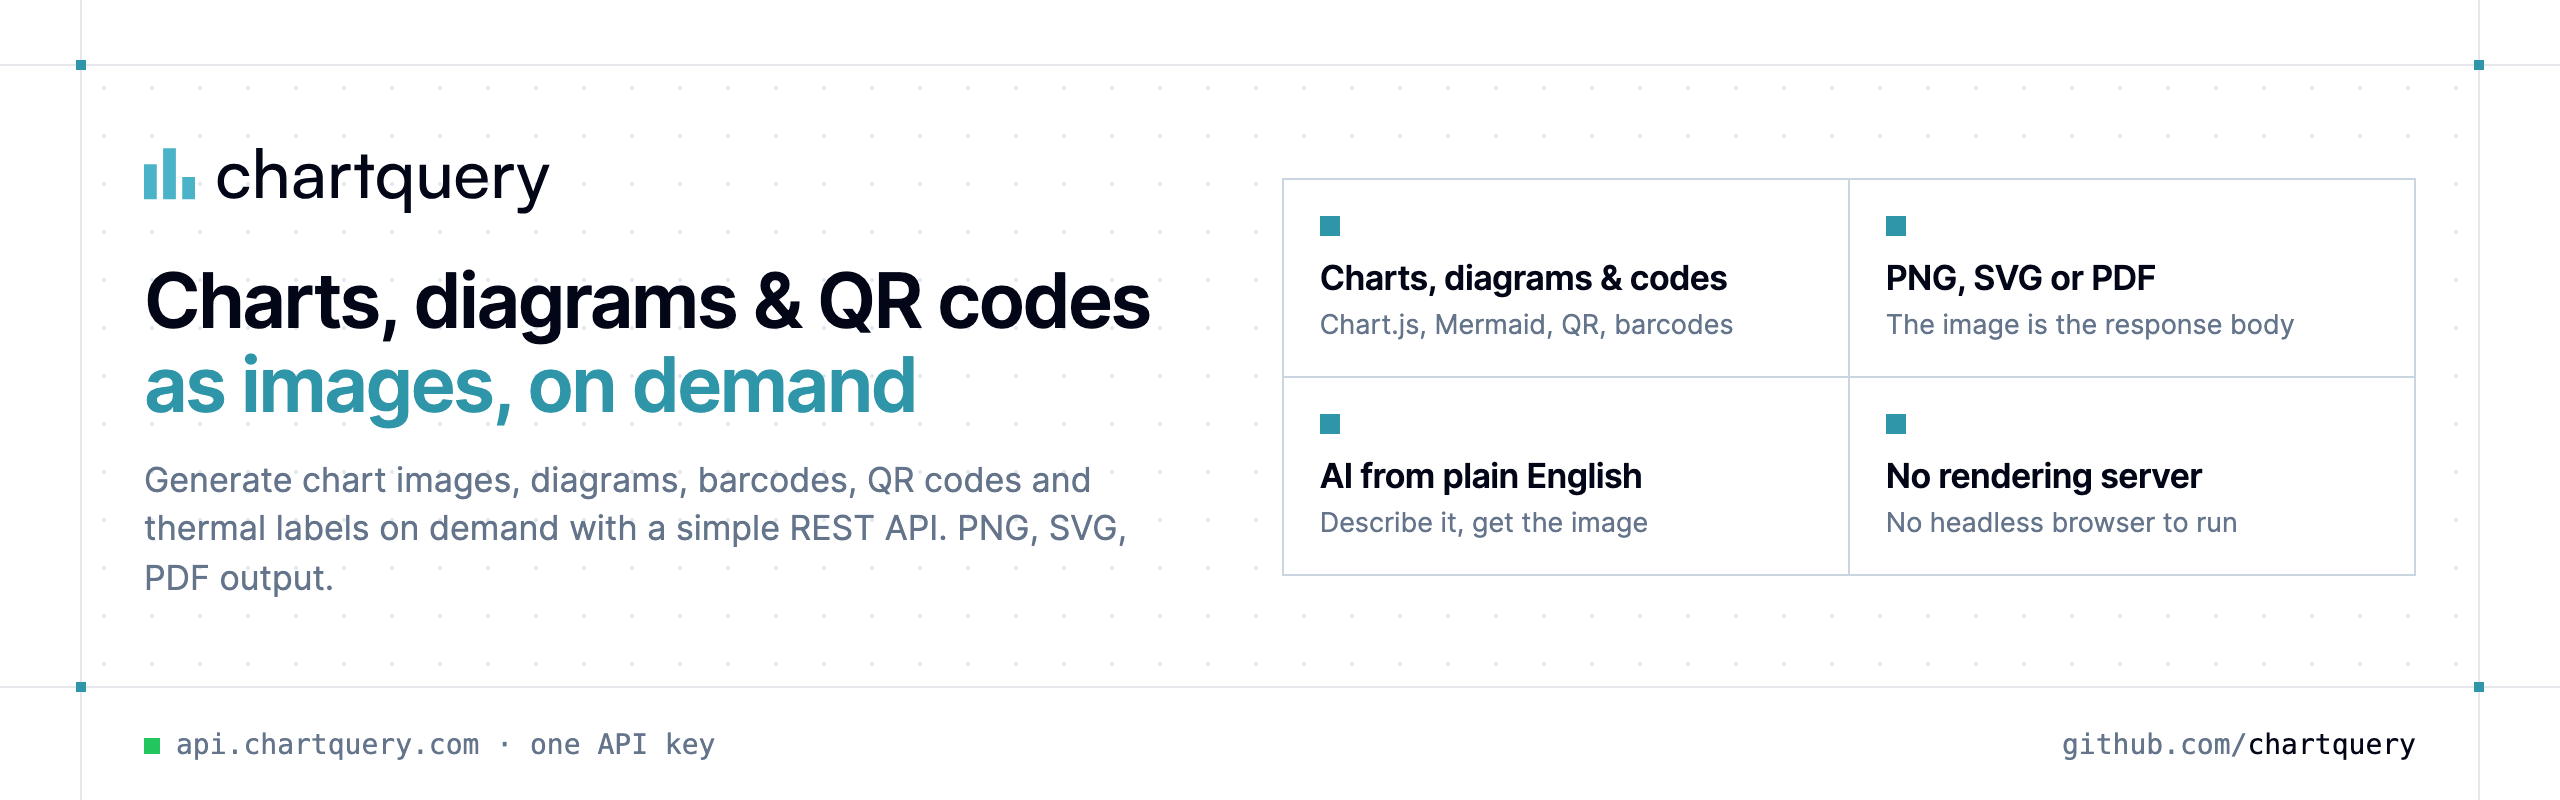
ChartQuery generates chart images, diagrams, barcodes, QR codes and thermal labels on demand with a simple REST API — PNG, SVG or PDF output, no rendering server needed. Describe a chart in plain English and AI renders it for you.
Why ChartQuery?
Images in one request — the response body is the PNG/SVG/PDF, ready for emails, PDFs, dashboards, Slack or <img> tags.
Charts, diagrams, QR codes, barcodes, labels — Chart.js configs, 28 diagram languages (Mermaid, Graphviz, PlantUML, D2…), 25+ barcode formats.
AI generation — describe a chart or diagram in plain English and get the rendered image.
No rendering infrastructure — no headless browser, fonts or libraries to maintain.
Copy-paste examples — Python and TypeScript in each README, 7 more languages in examples/.
Chart API by ChartQuery: Render Chart.js charts as images — or describe them in plain English. Python, TypeScript, cURL, PHP, C#, Go, Java, Ruby examples.
Thermal Label API by ChartQuery: Preview & compile thermal labels for TSC, ZPL, EPL and more. Python, TypeScript, cURL, PHP, C#, Go, Java, Ruby examples.
Thermal Label API by ChartQuery: Preview & compile thermal labels for TSC, ZPL, EPL and more. Python, TypeScript, cURL, PHP, C#, Go, Java, Ruby examples.
This organization has no public members. You must be a member to see who’s a part of this organization.
Top languages
Loading…
Uh oh!
There was an error while loading. Please reload this page.
Most used topics
Loading…
Uh oh!
There was an error while loading. Please reload this page.
You are visitor 01402503 — GeezerVison does not store the pages you look up. Best viewed with Netscape Navigator 4.7 or Internet Explorer 6 at 800×600. No cookies required.