GeezerVison is showing github.com — Build software better, together
Here are
315 public repositories
matching this topic...
Language:
All
Filter by language
Sort:
Most stars
Sort options
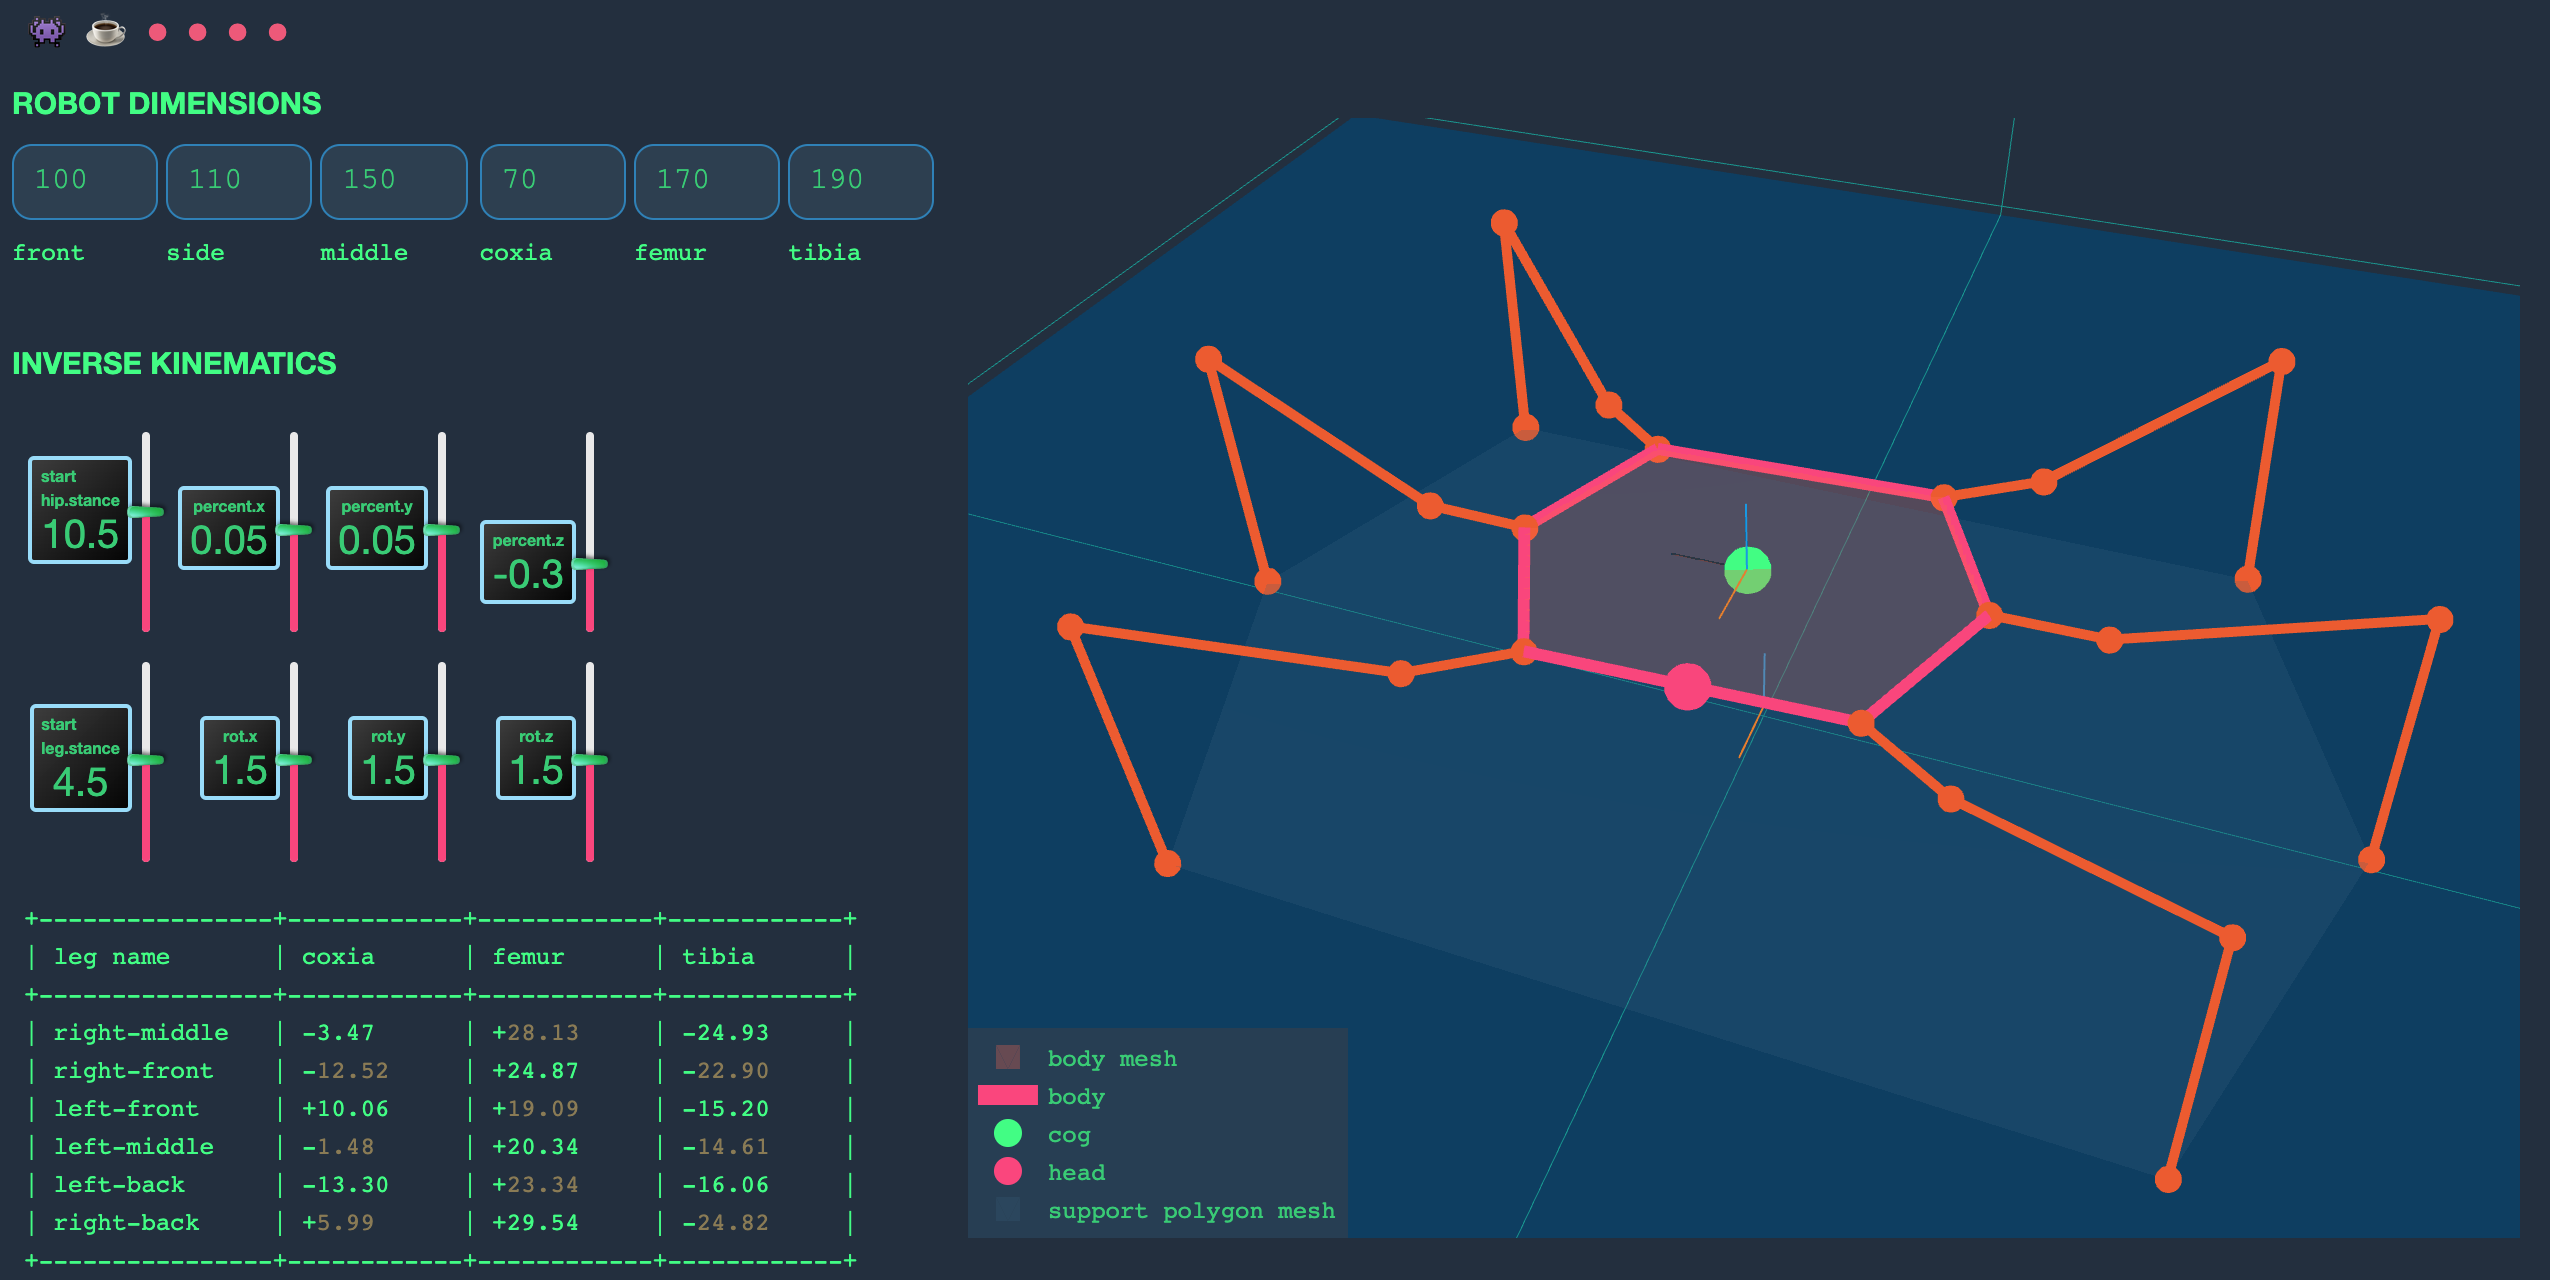
A hexapod robot simulator built from first principles
-
Updated
Jan 1, 2026
-
Python
Render and include figures in Pandoc documents using your plotting toolkit of choice
-
Updated
May 27, 2026
-
Haskell
The goal of the go-plotly package is to provide a pleasant Go interface for creating figure specifications which are displayed by the plotly.js JavaScript graphing library.

Resources for teaching & learning practical data visualization with python.
-
Updated
Mar 5, 2025
-
Jupyter Notebook
Fraud Detection on credit card transations
-
Updated
Jul 4, 2024
-
Jupyter Notebook
Data Visualizations is emerging as one of the most essential skills in almost all of the IT and Non IT Background Sectors and Jobs. Using Data Visualizations to make wiser decisions which could land the Business to make bigger profits and understand the root cause and behavioral analysis of people and customers associated to it. In this Reposito…
-
Updated
May 18, 2020
-
Jupyter Notebook
Curated Python Notebooks for Amazing Data Visualization
-
Updated
Dec 29, 2024
-
Jupyter Notebook
Sentiment Analysis Project using Natural Language Processing (NLP) Techniques
-
Updated
Jan 15, 2021
-
Jupyter Notebook
Portfolio of Dash Interactive Dashboards / Mini Apps
-
Updated
Feb 15, 2023
-
Python

A Python package for creating UpSet plots using Plotly
-
Updated
Mar 11, 2024
-
Python
Visualize your CSV in seconds by asking questions
-
Updated
Nov 9, 2025
-
Python
This project is python scripts, which uses mainly robinhood's private API and dash feature from plotly for creating visualized trading journal.
-
Updated
Oct 2, 2024
-
Python
🎟Using Plotly to visualize data from Lollapalooza
-
Updated
Jan 25, 2019
-
HTML
[python] 使用A*算法(A-star)的最短路径优化设计 (2d/3d)
-
Updated
Aug 19, 2022
-
Python
使用 plotly 绘制 Choropleth 地图。
-
Updated
Aug 10, 2021
-
Python
Python package for Plotly/Dash apps with support for multi-page, modules, and new charts such as Pareto with an Object Orient Approach
-
Updated
Aug 5, 2022
-
Python
A super trend indicator for US stocks
-
Updated
Jan 24, 2024
-
Python
Stock dashboard in python
-
Updated
Aug 17, 2024
-
Python
Generate/view WNBA stats, analytics, player comparison, chatbot, and AI insights
-
Updated
Oct 16, 2024
-
Python

A flask app using plotly, imdb api, python to display insights on various tv shows
-
Updated
Dec 28, 2020
-
Python
Add this topic to your repo
To associate your repository with the
plotly-python
topic, visit your repo's landing page and select "manage topics."
Learn more
|