GeezerVison is showing github.com — Build software better, together
Here are
44 public repositories
matching this topic...
Language:
All
Filter by language
Sort:
Most stars
Sort options
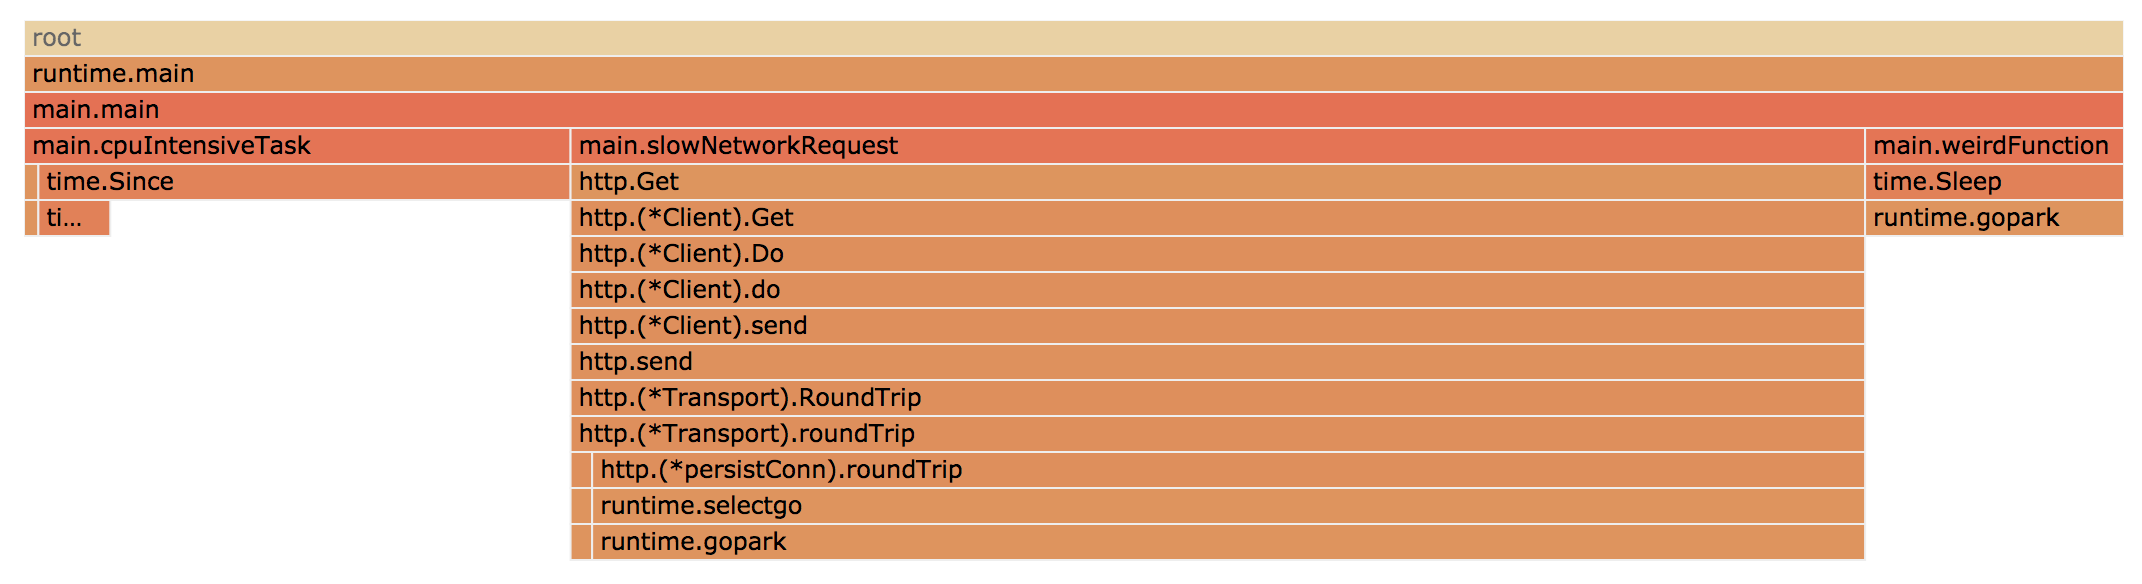
🚀 fgprof is a sampling Go profiler that allows you to analyze On-CPU as well as Off-CPU (e.g. I/O) time together.
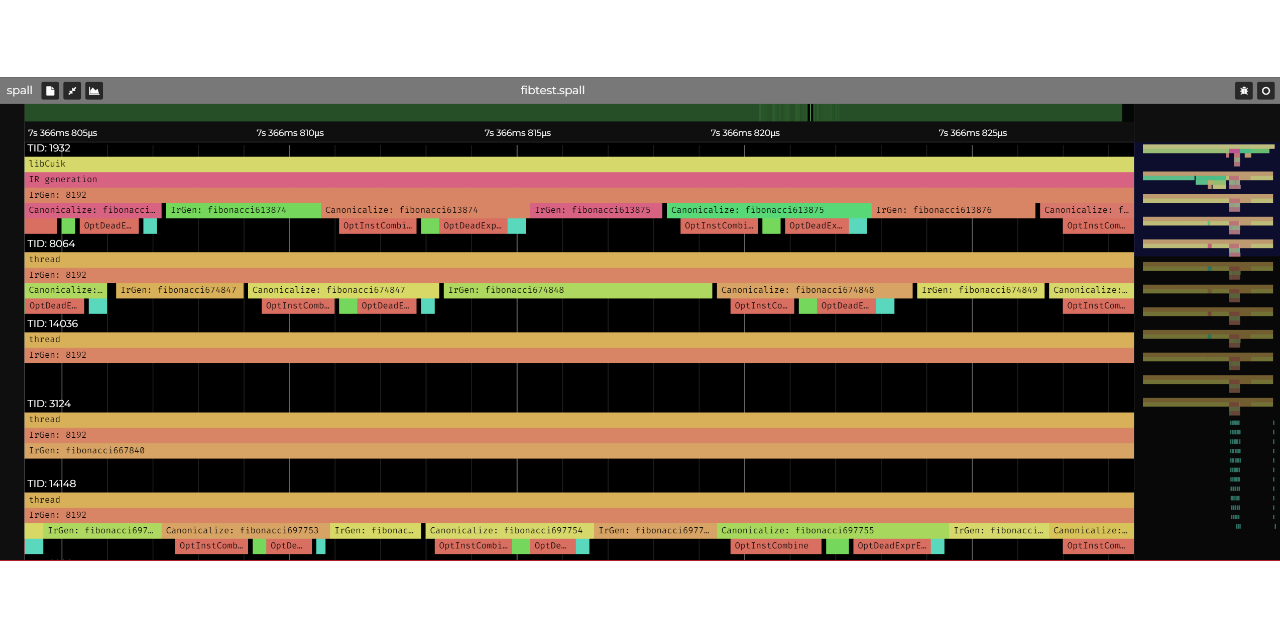
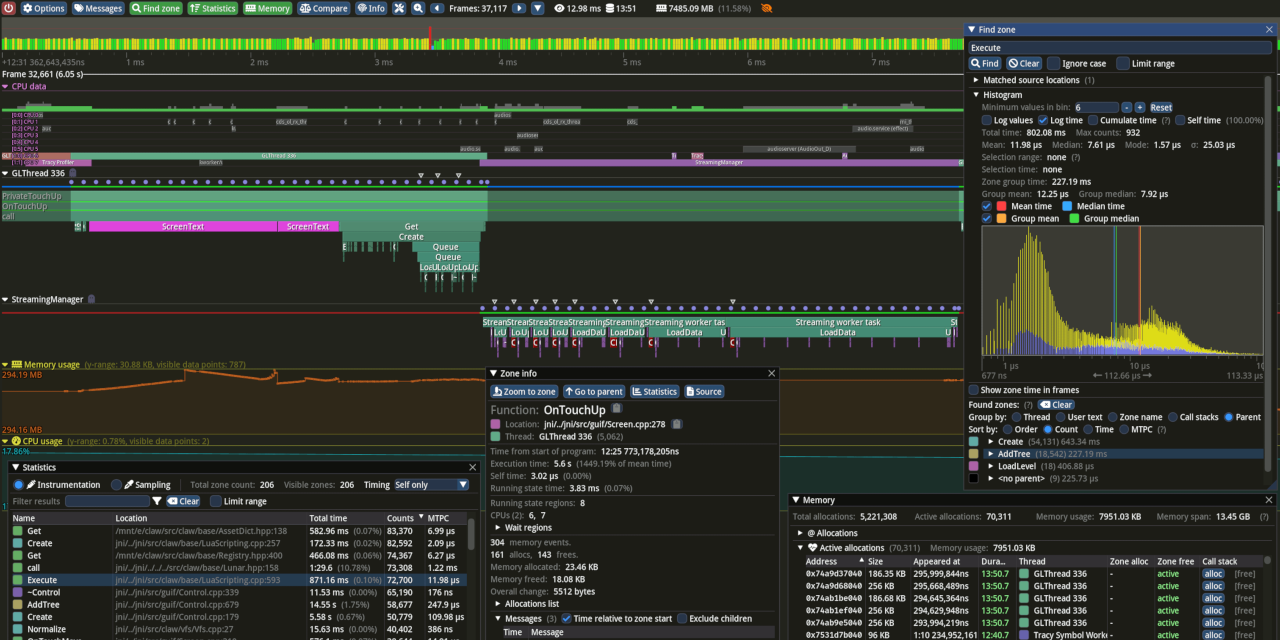
Simple, Fast, Portable Profiling
-
Updated
Jan 13, 2026
-
Odin
DEPRECATED StackImpact Go Profiler - Production-Grade Performance Profiler: CPU, memory allocations, blocking calls, errors, metrics, and more
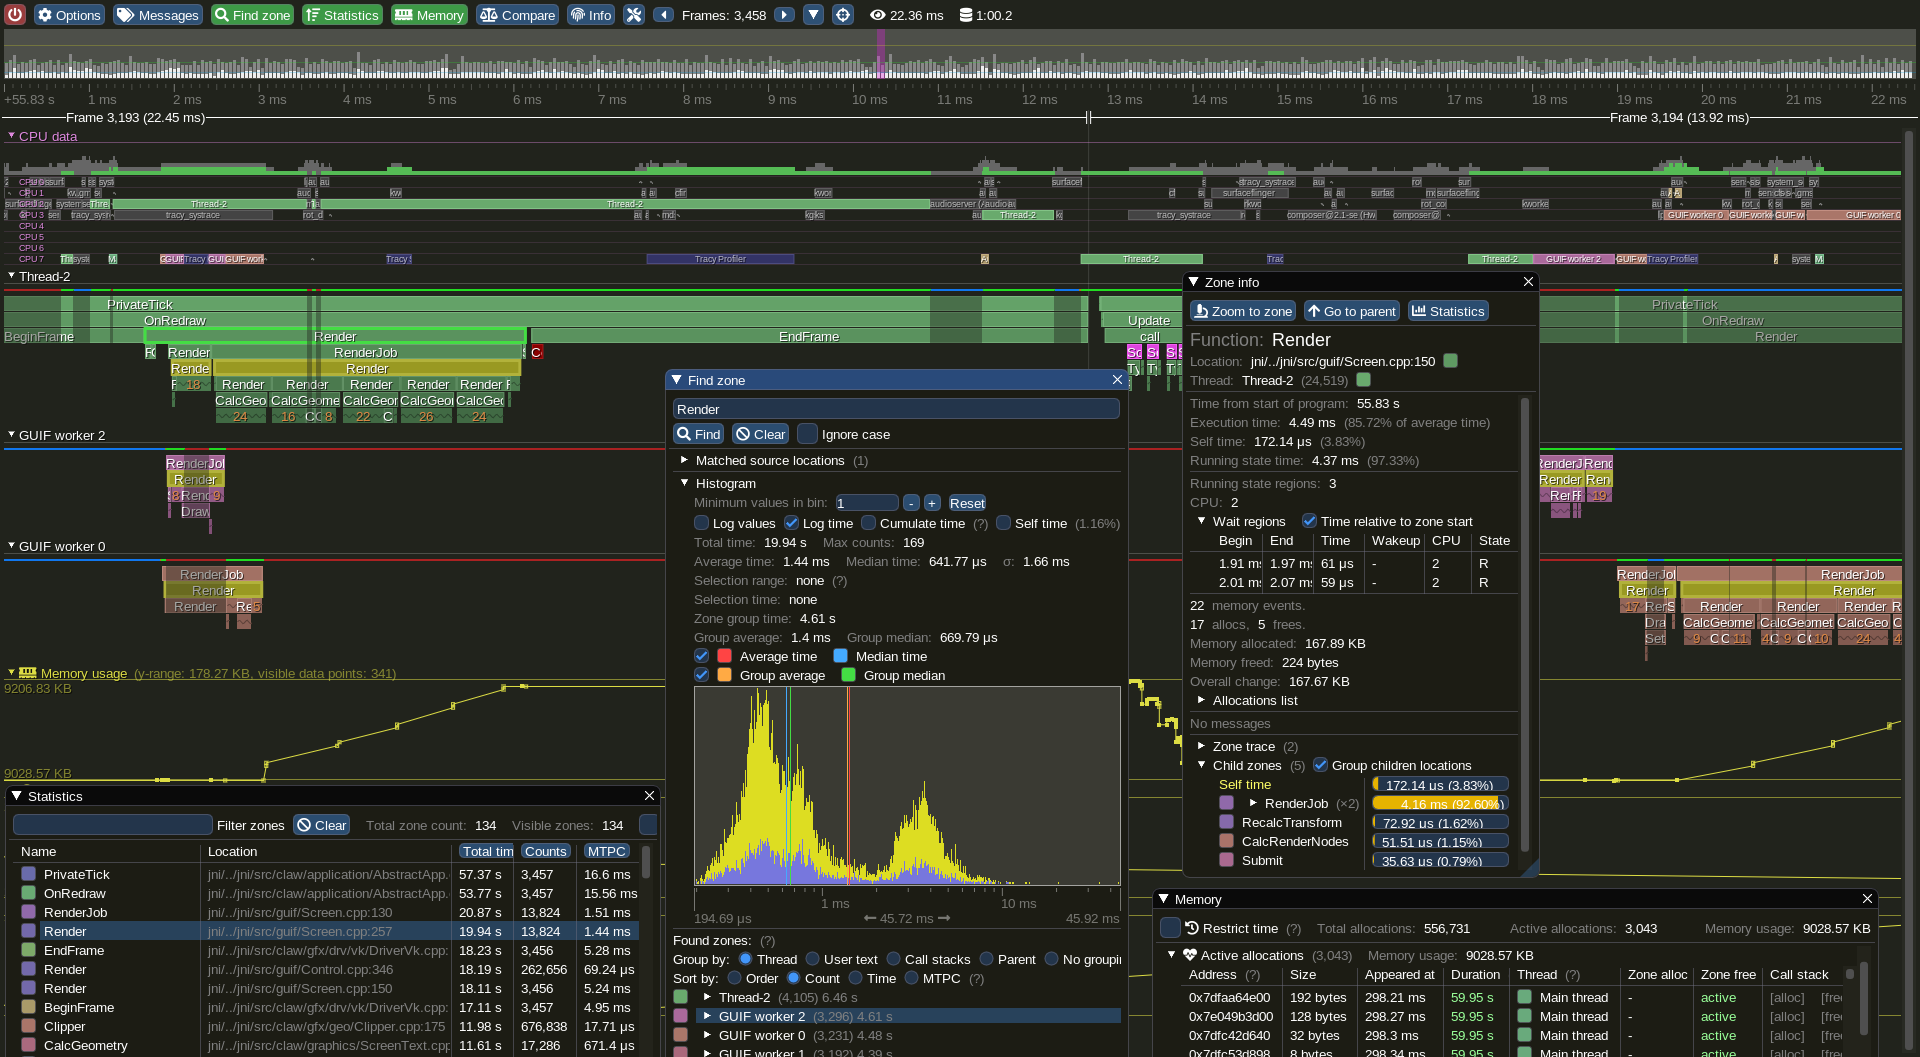
Tracy profiler bindings/wrapper for the Odin programming language
-
Updated
Aug 22, 2026
-
Odin
A Simple Profiling Library for OCaml
-
Updated
Jul 30, 2026
-
OCaml
Profile what you care, monitor how it goes (support C/C++)
-
Updated
Apr 28, 2017
-
Python
DEPRECATED StackImpact Node.js Profiler - Production-Grade Performance Profiler: CPU, memory allocations, async calls, errors, metrics, and more
-
Updated
Feb 26, 2020
-
JavaScript
C++ library for monitoring CPU, Memory and execution time targeting Linux embedded devices
A simple wrapper over Go runtime/pprof for running multiple concurrent profiles and dumping results to files.
LPGPU2 CodeXL power performance analysis and feedback tool for GPUs
Call-graph profiling for TwinCAT 3
-
Updated
Oct 24, 2023
-
Python
A modular program analysis tool framework for accelerators (NVIDIA, AMD, and DL workloads).
Laravel XHProf - Library for profiling in production.
JavaScript profiling tool, library and benchmark collection.
-
Updated
Jun 16, 2024
-
JavaScript
-
Updated
Jan 28, 2025
-
Python
⌚ Measure how long it takes for a program to execute in different clocks
A Memory Profiler for Pharo
-
Updated
Sep 24, 2026
-
Smalltalk
DEPRECATED StackImpact Java Profiler - Production-Grade Performance Profiler: CPU, locks, runtime metrics, and more
-
Updated
Oct 17, 2019
-
Java
Easily profile your Arduino functions to see how much time they take. The output can be disabled and enabled at runtime. Very lightweight. Optional output pin debugging and custom text output supported too.
Add this topic to your repo
To associate your repository with the
profiling-library
topic, visit your repo's landing page and select "manage topics."
Learn more
|