GeezerVison is showing h3dgamma.com — Nuclear Power Applications
Nuclear Power and Waste Applications
H3D® products are perfectly suited to the nuclear-power and waste industries. In fact, close cooperation with power-plant leaders in radiation protection and chemistry has been key in the development and refinement of many of the instruments listed here. Our systems are used at over 75% of US nuclear power plants as well as many plants worldwide.
Source Localization and Visualization
- Rapidly find source locations, identify radionuclides and activities
- Use radiation overlay images to supplement briefings
- Visualize hot spots or other areas of concern
- Use before/after measurements to validate changes
- Recommended series: H, P, A, or GammAware
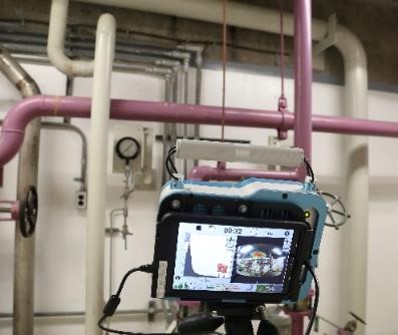
H3D's first industry offerings were focused on leveraging CZT-based detection methods to provide high-resolution portable imaging spectroscopy. This allows for quick understanding of what source(s) are impacting dose rates to workers and where these source(s) are located. These instruments provide instant feedback in the field with real-time spectroscopy and radiation overlay images. Visualizer post-processing software provides more powerful analysis options, including SourceTerm point-kernel modeling for activity analysis. Results can be used to identify and validate dose mitigation actions, provide excellent visuals to support worker briefings and work planning, and identify changes to the source term over time.
As examples:
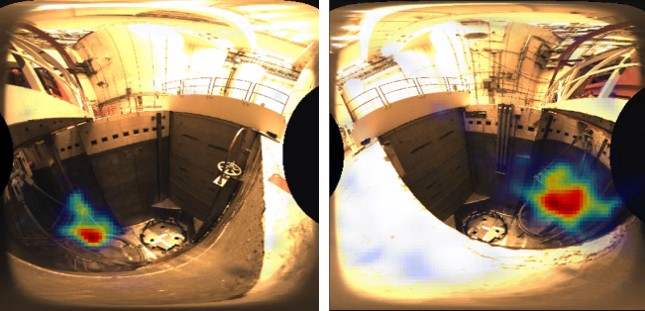
- A PWR identified higher-than-expected dose rates upon drain down of the reactor cavity. Dose rates were very high in the area of the upender; however traditional methods were initially unable to locate the source. An H-series spectrometer was successful at identifying the exact location of an irradiated metal piece under structural steel.
- A user identified higher-than-expected dose rates at the location of a low-dose-waiting-area. An H400 measurement located a hot spot in the high overhead that was subsequently flushed, with LDWA dose rates returning to normal.
- Several examples have been shared where users produce radiation overlay images in areas of higher dose rates to share with workers during pre-job briefings. The images provide excellent visualization of radiation source in the work area and contribute to reduced worker dose from optimal body positioning and transiting.
Verify the Adequacy of Temporary Shielding
- Perform pre-shielding surveys to support shielding evaluations
- Perform post-shielding surveys to verify effectiveness
- Visually identify gaps in shielding
- Recommended series: H, P, or GammAware
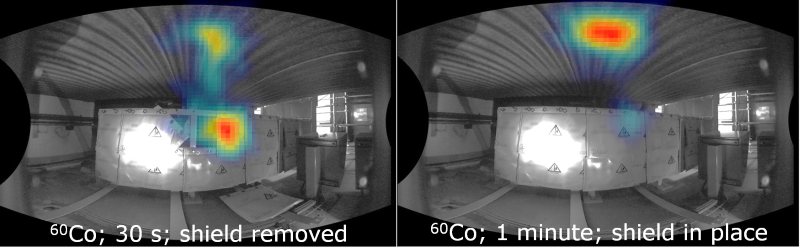
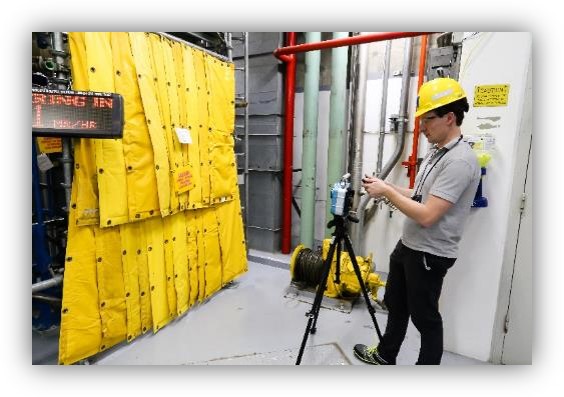
Early on, nuclear power plant customers recognized the power of using H3D imaging spectrometers as a tool to assist with optimizing shielding applications. While dose-rate impacts from installed shielding can be measured using traditional dose rate meters, H3D's imaging spectrometers provide the ability to visualize the resulting conditions, identify gaps in the applied shielding, or find other opportunities to improve the effectiveness of the shielding package. The ability to quickly identify the specific radionuclides being shielded can assist in optimizing the required shielding thickness for the dose-rate reduction required.
The photo above is showing an example of before-and-after imaging. On the left is an image that shows a "gap" in shield. On the right, the shield is replaced and the radiation overlay image demonstrates that the post-shielding conditions are improved - the larger dose impacts are now coming from the overhead instead of the component(s) that have been shielded.
As further examples:
- A shielding design was being planned to reduce dose rates from an area of piping; however, it wasn't clear which part(s) of the system should be shielded to significantly reduce the dose rate. An H100 was used in the area and it was discovered that a pipe segment under the floor was unexpectedly contributing most to the dose rate, yielding a shielding design that prioritized the floor and improved effectiveness.
- A P100 was used to image the temporary shielding around the reactor head to look for gaps that could impact dose rates in the surrounding area, including the refueling bridge. A P100 was appropriate to ensure that sources in other parts of the refuel floor did not impact the measurements. Imaging allowed for shielding adjustments, improving the effectiveness of the installation.
Site Surveys
- Locate and characterize sources inside buildings, vehicles, containers, etc.
- Perform dose-rate-equivalent surveys meeting industry-standard accuracy requirements
- Supplement dose-rate-equivalent surveys with information on radionuclide content
- Recommended series: A, H, or GammAware
H3D spectrometers can be used to supplement the plant's radiation survey program. The visualization/directionality capabilities of the instrument can assist with ensuring that the most-impacted areas of a room, container, or component have been captured - for instance, the radiation overlay image can help ensure that the highest dose rate on a shipping package is measured by the survey. Testing has shown that H3D instruments also provide accurate dose-rate information, consistent with industry standards like ANSI N42.17 and N42.34. And, of course, surveys performed with H3D spectrometers provide radionuclide-specific information that is lacking on traditional dose-rate meters.
For example:
- Some users post printouts of H3D spectrometer images on the access doors to radiologically significant areas or use the images in pre-job briefings. These images quickly inform workers of the locations to avoid, minimizing exposure.
- A plant discovered legacy Cs-137 particles painted into a floor. These had not been identified before with a traditional survey meter, though it was known that the general-area count rate was elevated there. A quick image using H100 pinpointed the location of the discrete radioactive particles, which were removed.
- H-Series spectrometers have also been used to aid in identifying and removing particles on equipment and scaffolding, preventing personal contamination events.
Radiologically-Controlled-Area Exit Point
- Identify radionuclides present in contamination
- Investigate the presence of NORM and medical radionuclides complicating RCA exit operations
- Recommended series: A, H, or P
When armed with H3D spectrometers, technicians have identified additional uses at the RCA exit point. The radionuclide-specific results can be helpful when responding to an alarm at the exit monitors or when assessing the potential impact of background/NORM on exit-point instrumentation.
For example:
- Some stations have reported success identifying low levels of contamination (or confirming NORM) on clothing, avoiding the need to use laboratory germanium.
- H3D instruments have been used in response to alarming exit monitors to provide local verification of radionuclides associated with a medical administration.
- One station used a portable CZT instrument to correlate instances of exit monitors going 'out-of-service' to the nuclides/times associated with standard effluent releases from the plant.
Radionuclide Trending and Source-Term Monitoring
- Perform real-time monitoring of system radionuclide content
- Measure the dose impact of radionuclides plated onto piping
- Monitor minute-by-minute impacts of planned and unplanned changes to reactor coolant
- Enable early detection and trending of unexpected changes, including fuel defects
- Investigate trends during online cycles to predict impacts on outage dose.
- Inform source-term reduction strategies and validate source-term successes
- Recommended series: GammaTrend using S and/or P100S
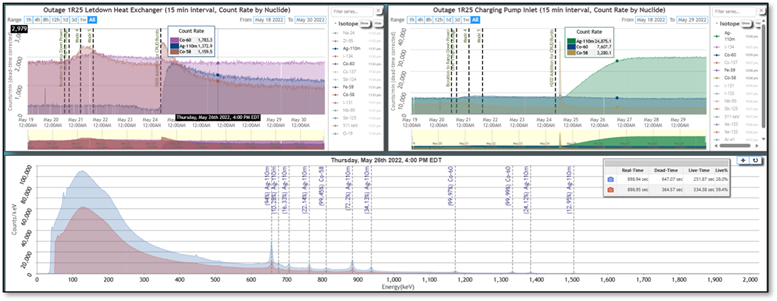
H3D's GammaTrend system leverages the field-deployable, high-resolution CZT spectroscopy to provide real-time source-term trending of the reactor coolant systems. GammaTrend provides minute-by-minute results coupled with powerful trending software equipped to monitor the source-term impacts and investigate reasons for changes in the process stream.
Plants use GammaTrend to:
- Supplement water sampling results during forced oxidation periods in PWRs
- Continuously monitor for (and trend) fuel defects
- Measure the impact of changes to plant chemistry or resulting from strategic dose-reduction efforts
GammaTrend instruments (typically S100 or P100S) can be deployed over long periods of time (years or operating cycles) with minimal attention required to keep the system operational, which allows for "outage vs outage" or "unit vs unit" comparisons.
See this article for a more complete write-up highlighting the GammaTrend system.
Shipping, Waste Characterization, Cargo Inspection
- Quickly locate where in container needs shielding
- Visually identify area(s) of highest dose rate to support shipping survey
- Ensure cargo meets shipping and receiving requirements
- Test homogeneity of container contents
- Improve characterization accuracy by coupling dose rate and spectroscopy in one instrument
- Perform advanced quantification in post-processing to account for shielding, source geometry, and distributed sources
- Recommended series: A, H, P, or GammAware
Field-deployable spectroscopy is especially useful when supporting the plant's radioactive material/waste shipping and characterization activities. Visualization of radiation, radionuclide-specific results, accurate dose-rate measurements and quantification of container radionuclide contents are all critical components of a successful shipment.
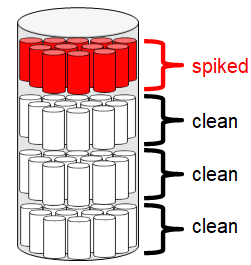
H3D instruments have performed well (and on par with HPGe-based platforms) in blink-spike studies using waste-applicable containers, as described below.
Example uses include:
- Some plants require the use of an H-series measurement on significant outgoing shipments to ensure that the highest dose-rate location is visually located during survey. Visualization can also support ensuring that the highest dose-rate contents are optimally placed and/or shielded within the conveyance.
- One station used an H100 to verify that dose rates from a "non-rad" waste container were being produced from natural thorium from switchyard waste.
- Accurate dose rates and gamma radionuclide fractions can support waste characterization and more accurately determine waste classification. Visit WMG for an example of cutting-edge technology to improve waste characterization.
SourceTerm at the Nuclear Industry Proficiency Test Exercise 2019
The H3D H420 was used in conjunction with SourceTerm software package at the Nuclear Industry Proficiency Test Exercise in 2019.
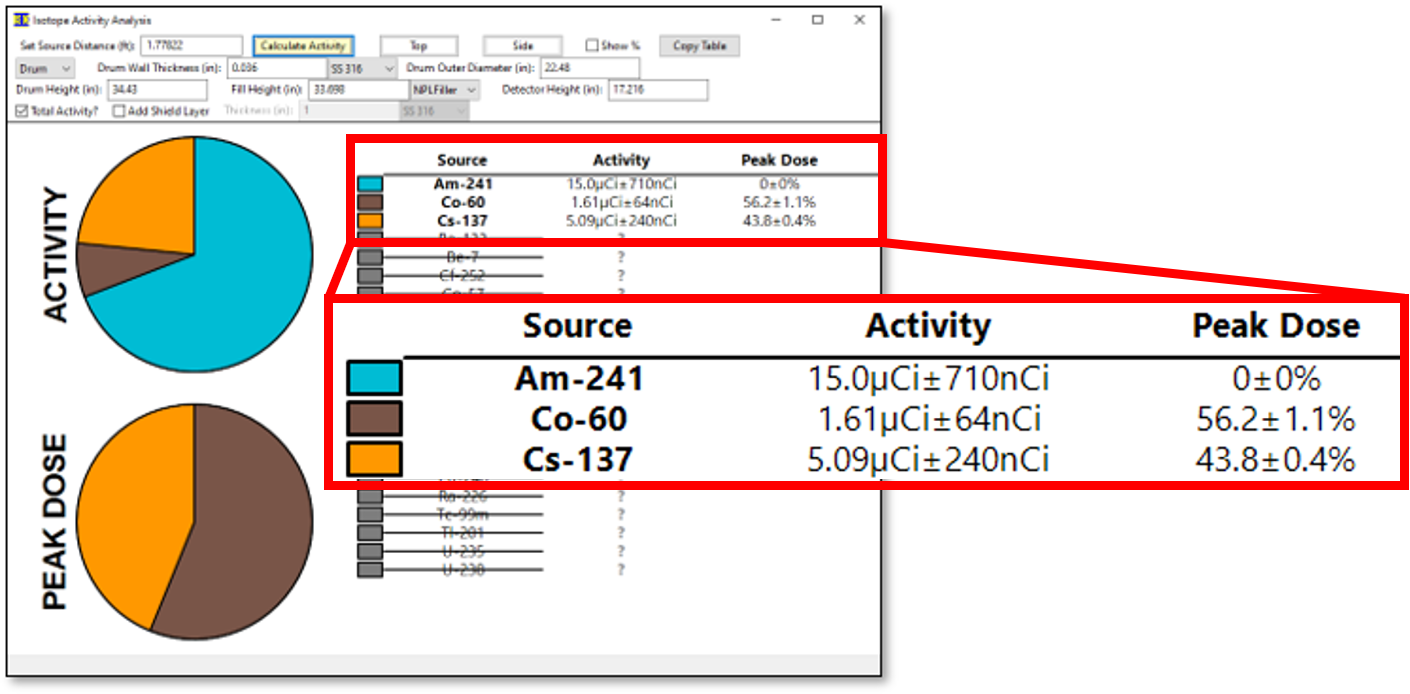
Prior to measurment, a waste drum was spiked with Cs-137, Co-60, and Am-241. The location of these isotopes was not disclosed
before measurements were taken.
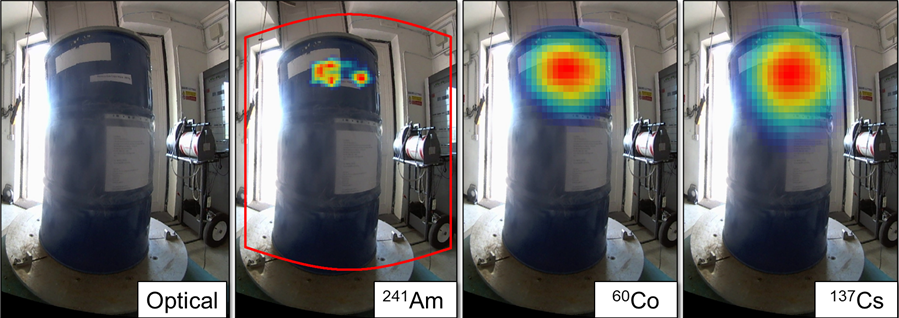
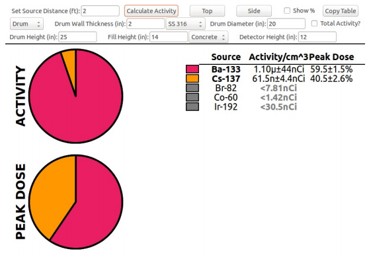
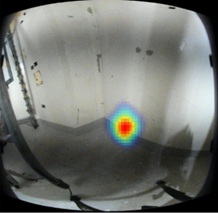
The H420 was able to locate and identify the source package in the upper chamber of the waste drum as Am-241, Co-60, and Cs-137 (shown above).
Using SourceTerm in post-processing, the source package was further analyzed and accurately quantified (shown to the left).
Decommissioning and Dismantling
- Similar to the uses above, H3D field instruments can support decommissioning missions
- Obtain visualization of remaining contamination to support release
- Support of waste shipping and characterization
- Recommended series: A, H (especially H400 or H1600), or GammAware
Detecting radioactive contamination that is of similar strength to the natural background is difficult, but necessary, during decommissioning and cleanup.
Higher-efficiency CZT detectors, such as the H400 and H1600, offer a number of advantages in this environment, including high imaging efficiency, isotope discrimination, and portability. High imaging efficiency means that it can make an image of gamma-ray intensity isotope-by-isotope in a reasonable time, even near background levels. Given enough count time, these units are capable of detecting and imaging sources weaker than natural radiation background. Therefore, H400 is a good tool to identify residual contamination that need to be cleaned. Once these are identified and cleaned, a standard, non-imaging detector can be placed close to perform clearance measurements.
As an example:
- A decommissioning site was preparing for final demolition of a volume control tank room when a 30-minute measurement using an H400 identified an area of remaining Co-60 along the base of one wall (see picture above). Additional efforts were then conducted to remove the remaining activity prior to demolition.
This website uses cookies to ensure you get the best experience. Learn More
|