GV

GeezerVison

The World Wide Web, restored to 800 pixels of glory.

Home|About|Gaming cabinet|Archives|How it works|Starter sites

On this site

  • Python Data Science Handbook
  • About
  • Archive

This view

  • Original page
  • New address

GeezerVison is showing jakevdp.github.io — Python Data Science Handbook | Python Data Science Handbook

Jake VanderPlas

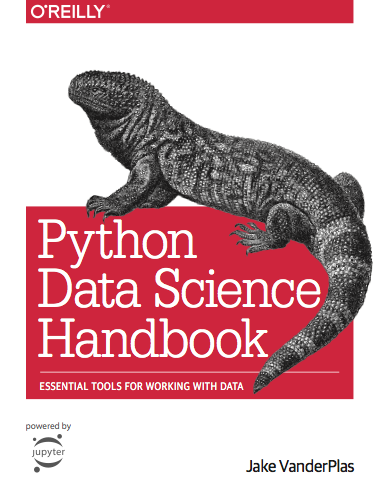
Book Cover

This website contains the full text of the Python Data Science Handbook by Jake VanderPlas; the content is available on GitHub in the form of Jupyter notebooks.

The text is released under the CC-BY-NC-ND license, and code is released under the MIT license.

If you find this content useful, please consider supporting the work by buying the book!

Table of Contents

Preface

1. IPython: Beyond Normal Python

  • Help and Documentation in IPython
  • Keyboard Shortcuts in the IPython Shell
  • IPython Magic Commands
  • Input and Output History
  • IPython and Shell Commands
  • Errors and Debugging
  • Profiling and Timing Code
  • More IPython Resources

2. Introduction to NumPy

  • Understanding Data Types in Python
  • The Basics of NumPy Arrays
  • Computation on NumPy Arrays: Universal Functions
  • Aggregations: Min, Max, and Everything In Between
  • Computation on Arrays: Broadcasting
  • Comparisons, Masks, and Boolean Logic
  • Fancy Indexing
  • Sorting Arrays
  • Structured Data: NumPy's Structured Arrays

3. Data Manipulation with Pandas

  • Introducing Pandas Objects
  • Data Indexing and Selection
  • Operating on Data in Pandas
  • Handling Missing Data
  • Hierarchical Indexing
  • Combining Datasets: Concat and Append
  • Combining Datasets: Merge and Join
  • Aggregation and Grouping
  • Pivot Tables
  • Vectorized String Operations
  • Working with Time Series
  • High-Performance Pandas: eval() and query()
  • Further Resources

4. Visualization with Matplotlib

  • Simple Line Plots
  • Simple Scatter Plots
  • Visualizing Errors
  • Density and Contour Plots
  • Histograms, Binnings, and Density
  • Customizing Plot Legends
  • Customizing Colorbars
  • Multiple Subplots
  • Text and Annotation
  • Customizing Ticks
  • Customizing Matplotlib: Configurations and Stylesheets
  • Three-Dimensional Plotting in Matplotlib
  • Geographic Data with Basemap
  • Visualization with Seaborn
  • Further Resources

5. Machine Learning

  • What Is Machine Learning?
  • Introducing Scikit-Learn
  • Hyperparameters and Model Validation
  • Feature Engineering
  • In Depth: Naive Bayes Classification
  • In Depth: Linear Regression
  • In-Depth: Support Vector Machines
  • In-Depth: Decision Trees and Random Forests
  • In Depth: Principal Component Analysis
  • In-Depth: Manifold Learning
  • In Depth: k-Means Clustering
  • In Depth: Gaussian Mixture Models
  • In-Depth: Kernel Density Estimation
  • Application: A Face Detection Pipeline
  • Further Machine Learning Resources

Appendix: Figure Code

You are visitor 01402503 — GeezerVison does not store the pages you look up.
Best viewed with Netscape Navigator 4.7 or Internet Explorer 6 at 800×600. No cookies required.