GV

GeezerVison

The World Wide Web, restored to 800 pixels of glory.

Home|About|Gaming cabinet|Archives|How it works|Starter sites

On this site

  • Plot types
  • User guide
  • Tutorials
  • Examples
  • Reference
  • Contribute
  • Releases
  • Gitter
  • Discourse
  • GitHub
  • Pairwise data
  • plot(x, y)
  • scatter(x, y)
  • bar(x, height)

This view

  • Original page
  • New address

GeezerVison is showing matplotlib.org — triplot(x, y) — Matplotlib 3.11.2 documentation

Note

Go to the end to download the full example code.

triplot(x, y)#

Draw an unstructured triangular grid as lines and/or markers.

See triplot.
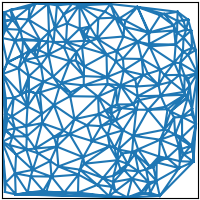
triplot
import matplotlib.pyplot as plt
import numpy as np

plt.style.use('_mpl-gallery-nogrid')

# make data:
np.random.seed(1)
x = np.random.uniform(-3, 3, 256)
y = np.random.uniform(-3, 3, 256)
z = (1 - x/2 + x**5 + y**3) * np.exp(-x**2 - y**2)

# plot:
fig, ax = plt.subplots()

ax.triplot(x, y)

ax.set(xlim=(-3, 3), ylim=(-3, 3))

plt.show()

Download Jupyter notebook: triplot.ipynb

Download Python source code: triplot.py

Download zipped: triplot.zip

Gallery generated by Sphinx-Gallery

You are visitor 01402503 — GeezerVison does not store the pages you look up.
Best viewed with Netscape Navigator 4.7 or Internet Explorer 6 at 800×600. No cookies required.