GeezerVisonThe World Wide Web, restored to 800 pixels of glory. |
| Home|About|Gaming cabinet|Archives|How it works|Starter sites |
GeezerVison is showing mindfusion.dev — JavaScript Chart Library | JS Chart by MindFusion 
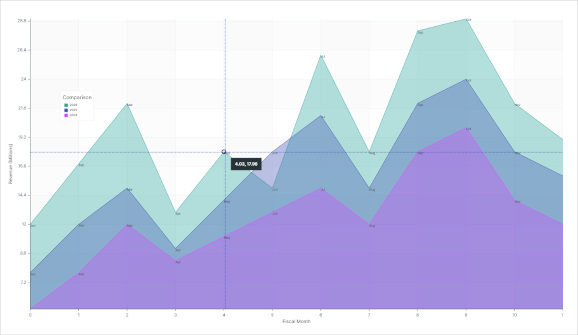
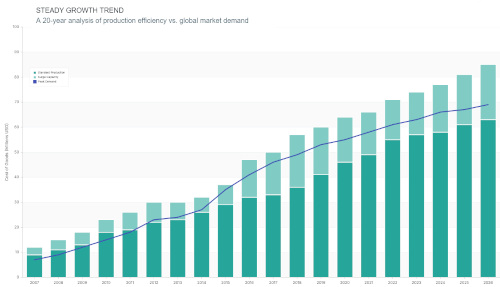
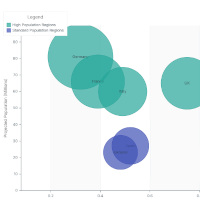
Interactive Chart & Dashboard Components for JavaScriptMindFusion.Charting for JavaScript is a comprehensive library for building sophisticated data visualizations. From real-time financial stock charts and industrial IoT dashboards to complex scientific plots, our component provides the performance and flexibility required for modern web applications. Visualizing Data Across Every DomainFrom financial trading platforms to industrial IoT monitoring, MindFusion.Charting for JavaScript delivers the precision and performance required for mission-critical web applications. 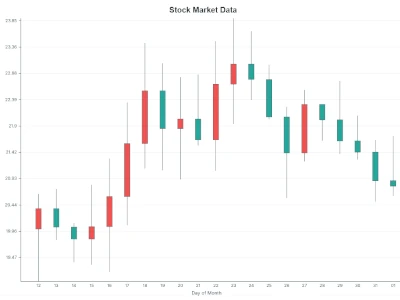
Financial & Stock AnalysisRender real-time candlestick charts and technical indicators with high-performance updates and interactive zooming. 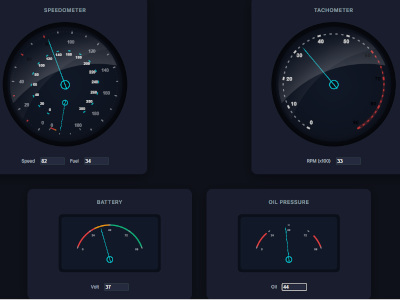
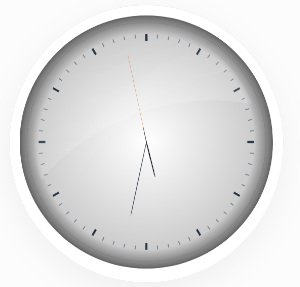
Interactive GaugesOval and linear gauge controls that are easy to turn into any type of thermometer, clock, compass, or complex car dashboard. 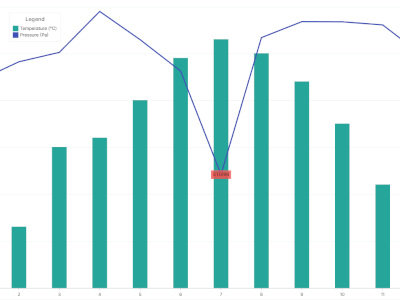
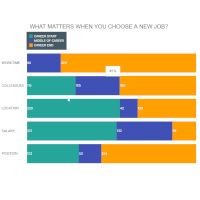
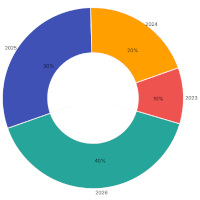
Business IntelligenceCommunicate complex metrics with stacked bar charts, pie charts, and funnel visualizations designed for executive reports. 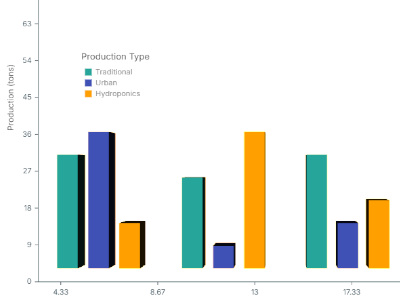
Scientific & 3D ModelingVisualize multi-dimensional datasets using advanced 3D bar charts and cylinder plots with full rotation and perspective control. 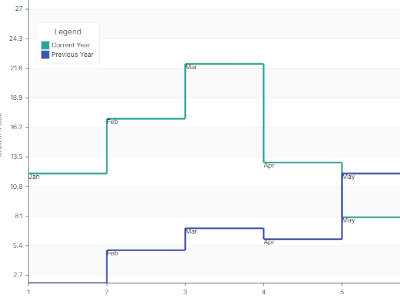
Project & Resource PlanningMonitor project milestones and resource allocation using step charts and interactive timelines to keep your operations on schedule. 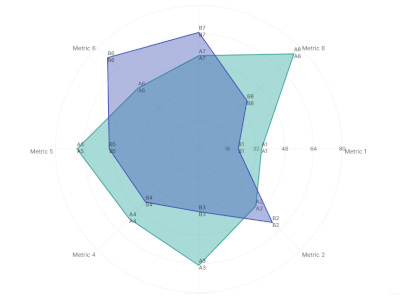
Product & Team PerformanceEvaluate multi-dimensional data using radar and polar charts to compare product features or visualize performance metrics. Intelligent Layouts & InteractionGo beyond static images. Build a truly responsive visualization experience where every element is interactive and accurately positioned.
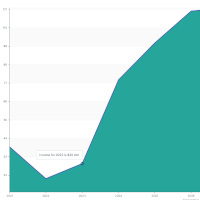
Comprehensive Visualization SuiteOur JavaScript suite includes specialized components to handle every aspect of data presentation and user input. 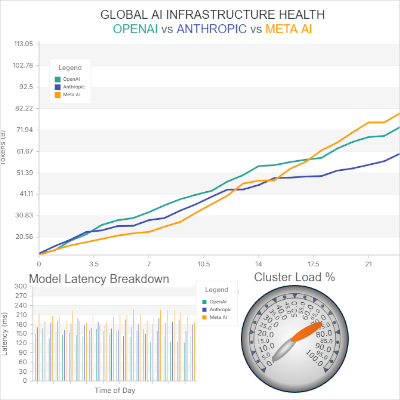
Industrial & IoT DashboardsBuild live telemetry views using customizable radial gauges, thermometers, and digital readouts for real-time monitoring. 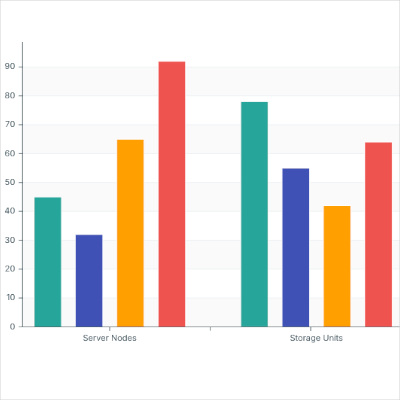
Multi-Series & Multi-Axis SupportIntegrate an unlimited number of data series—mixing lines, bars, and areas—onto a single, unified chart. 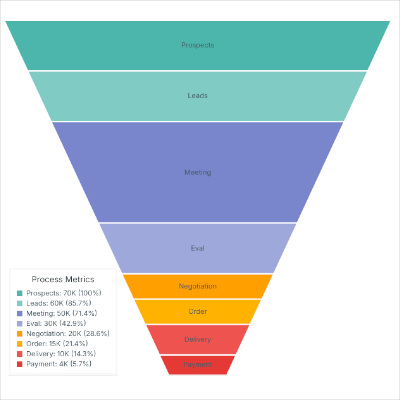
Multi-Stage Data VisualizationFollow sequential processes and conversion flows using a versatile suite of specialized charts, including hhigh-fidelity funnels and incremental step series. 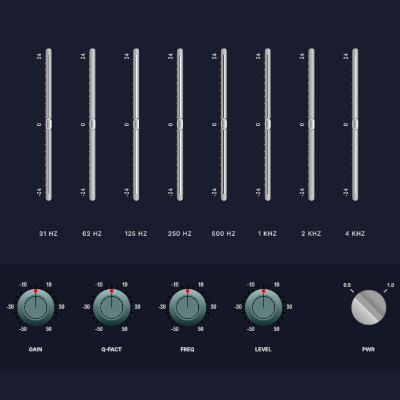
Bespoke Gauge InterfacesUtilize flexible custom drawing to design unique gauge interfaces that simulate professional hardware - from sleek automotive dashboards to minimalist precision clocks. Why Choose MindFusion JavaScript Chart?
Elegant & Powerful APIDesigned for developers, providing a flexible class structure that allows elements to be combined and inherited as needed. 
Flexible Data HandlingSupport for universal series interface, DateTime values, XML data, and deep data binding to custom objects. 
High-Performance EngineRender vast datasets with speed and precision, ensuring smooth interactions and instantaneous updates. 
TypeScript SupportBuilt-in TypeScript definitions and samples ensure type-safety and intelligent autocomplete in your favorite IDE. 
Direct Engineering SupportSkip the front-line reps and get answers directly from the developers who built the library, usually within hours. MindFusion Pack for JavaScript
NewsCompanyClients Testimonials About Us Services Contacts Online Store Blog News Feed Newsletter E-mail: [email protected] Copyright © 2001-2026 MindFusion LLC. All rights reserved.
|
| You are visitor 01402503 — GeezerVison does not store the pages you look up. Best viewed with Netscape Navigator 4.7 or Internet Explorer 6 at 800×600. No cookies required. |


