GeezerVisonThe World Wide Web, restored to 800 pixels of glory. |
| Home|About|Gaming cabinet|Archives|How it works|Starter sites |
GeezerVison is showing numericalalgorithmsgroup.github.io — NAGJavaExamples
Nonlinear Least-Squares Trust-Region Method (BXNL)[ Data fitting and calibrating parameters of complex numerical models is one of the most common
problems found in numerous industries such as physics, space exploration, simulations, engineering, amongs many others.
NAG introduces to the NAG Library at Mark 27.1 a novel nonlinear least-square trust-region solver for unconstrained or bound-constrained fitting problems, The solver Figure 1 shows an illustrative simple problem of data fitting (more details). The task is to find the optimal orbit path given a variety of measurements for which the orbit has to approximatly pass-by. 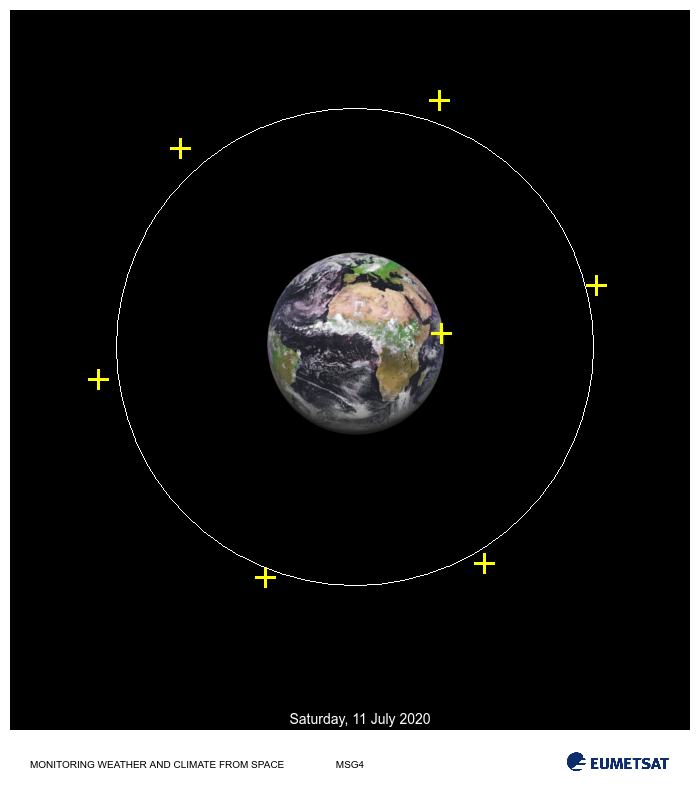
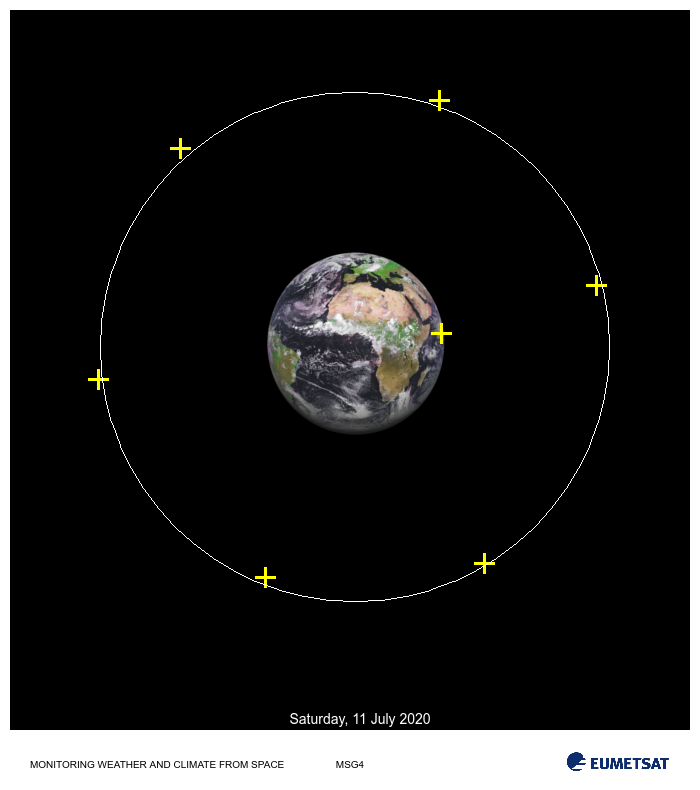
Figure 1. Example of a NLLS orbital data fitting. Given a set of 7 orbital data points the task is to estimate an optimal orbit path that minimizes the error between the path and the fixed data points. For this example assume that expert knowledge provides insight on the reliability of each measument and that for this satellite configuration operational orbit height should around 250 +/-3 units. Center plot shows a simple fit where each measurement (data point) contributes the same amount and provides an optimal orbit height of 238.76 units. The fit is quite poor in the sense that it does not satisfy expert advice. Evidently data point 0 (yellow cross closest to earch surface) unreliablity should be taken into account while doing the fitting. Weights for the residuals should be proportional to the inverse of their variability. For this example suppose we are provided with the accuracy for each of the data measurements, this can be factored using weighted nonlinear least-squares. The rightmost plot shows the weighted optimal solution with orbit height of 254.90 units wich is withing the suggested tolerance. Image credit: Image of Earth was taken from EUMETSAT, Copyright 2020. More Info
Unfolding Nuclear Track Data[More details for this example] This example illustrates the usage of The example uses 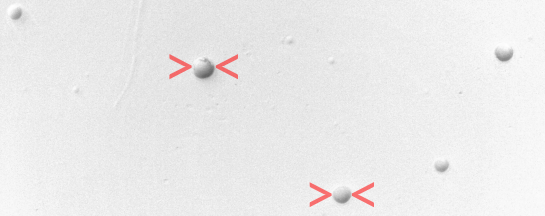
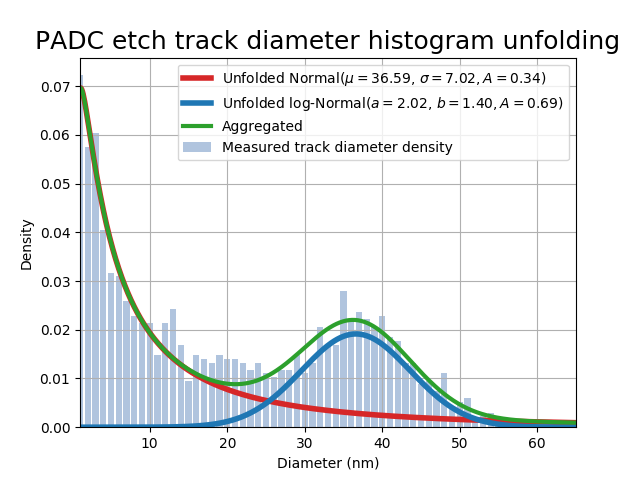
Figure 2. Left: example of a PADC target with alpha particle etched tracks, wedges in red show the track diameter. Right: experimental data histogram of track diameters (blue bars), aggregated model used in the fitting (green curve) and unfolded models (blue and red curves). Optimal parameter values are reported in the legend. Modern Replacement AlternativeSolver More recent and modern methods have been incorporated into Contrasting the three plots, it can be seen that the new solver is more efficient in time: solves 60% of the problems faster (left plot). In general terms it is more robust (solves 25% more problems) and less expensive in terms of user call-backs: 55% of problems require less function calls (center plot) and 65% of the problems require less gradient evaluations (right plot).
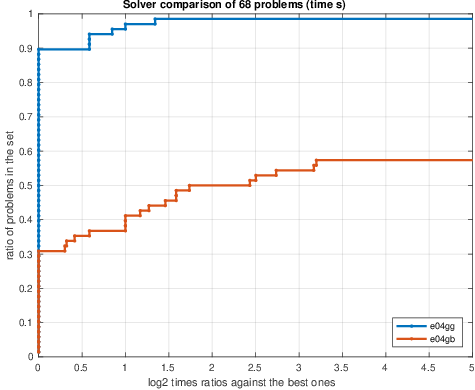
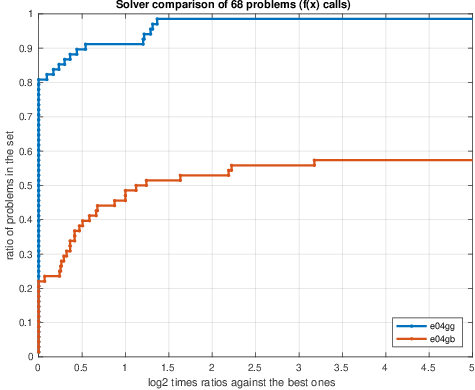
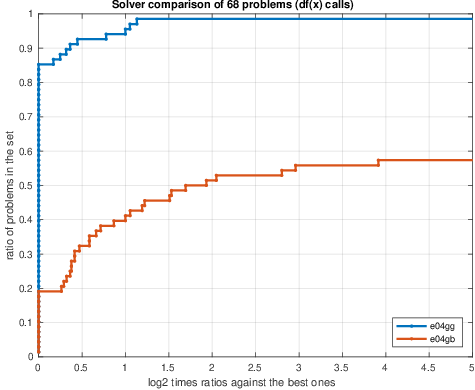
Figure 3. Performance profiles comparing solvers e04gg and e04gb over 68 CUTEst unconstrained nonlinear least-squares problems. Performance measure are: time in seconds (left), number of function calls (center) and number of gradient calls (right). For the time plot (left), higher line indicates faster solver. For the center and right plots, higher line represent less functions and gradients calls. References
|
| You are visitor 01402520 — GeezerVison does not store the pages you look up. Best viewed with Netscape Navigator 4.7 or Internet Explorer 6 at 800×600. No cookies required. |