GV

GeezerVison

The World Wide Web, restored to 800 pixels of glory.

Home|About|Gaming cabinet|Archives|How it works|Starter sites

On this site

  • Our World in Data
  • Data
  • Latest
  • Donate
  • Hannah Ritchie
  • Pablo Rosado
  • Max Roser

This view

  • Original page
  • New address

GeezerVison is showing ourworldindata.org — Energy

The world lacks a safe, low-carbon, and cheap large-scale energy infrastructure.

Until we scale up such an energy infrastructure, the world will continue to face two energy problems: hundreds of millions of people lack access to sufficient energy, and the dominance of fossil fuels in our energy system drives climate change and other health impacts such as air pollution.

To ensure everyone has access to clean and safe energy, we need to understand energy consumption and its impacts around the world today and how this has changed over time.

On this page, you can find all our data, visualizations, and writing relating to energy.

Download all data on energy

Related Topics

  • CO₂ and Greenhouse Gas Emissions
  • Air Pollution
  • Oil Spills

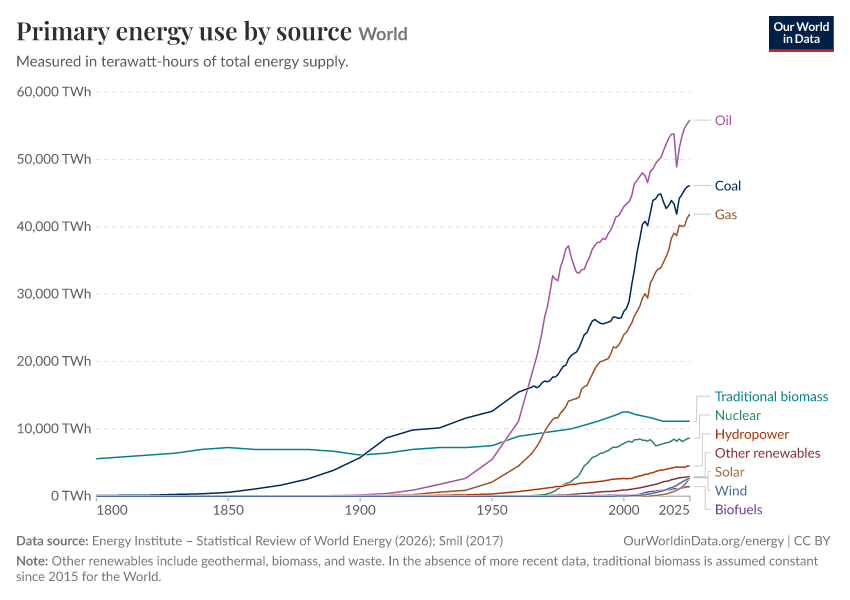
Primary energy use and sources

There are several ways to measure energy consumption. In one of our articles, we explain some of these in more detail.

One of those measures is primary energy. That is, the amount of energy that goes into our energy system before it’s been transformed into anything else. It’s the energy content of the coal and gas we burn in power plants, or the energy content of the oil before we burn it in cars, ships or planes.

That means it doesn’t capture the amount of energy that humans actually consume at the end of the chain, because a lot of that energy is wasted along the way.

This is the metric that many international organizations that publish energy data use, which is why we present it here. We would also like to present data on final or useful energy consumption, but there are no international, open databases that would allow us to do so.

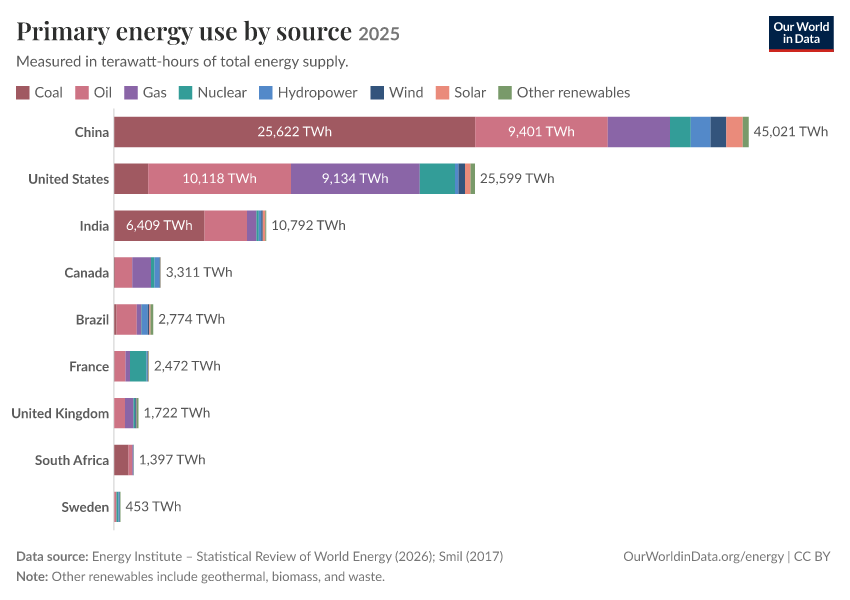
In this chart, you can explore data on primary energy use: how much is consumed in total, how much is consumed per person, and which sources it comes from.

From this data, we see:

  • Global primary energy use has grown dramatically over centuries, due to a combination of population and economic growth. This century, it has increased by more than 50%.
  • There are huge differences in energy use per person across the world. North Americans consume more than twice the global average, and more than ten times as much as the average across Africa.
  • Most of the world’s primary energy still comes from fossil fuels, although this share is declining. This specific data overstates the role of fossil fuels in final energy consumption, though, because a large amount of fossil fuel energy is wasted during combustion.
  • There are a small number of countries where fossil fuels, collectively, are not the largest source of primary energy, such as France, Sweden, and Norway. But in most, this is still the case.

Keep in mind that primary energy use is the total energy consumption from all sectors: transport, industry, commercial, and residential.

Electricity, which many people first think of, is just one subset of total energy use. That’s what we’ll look at next.

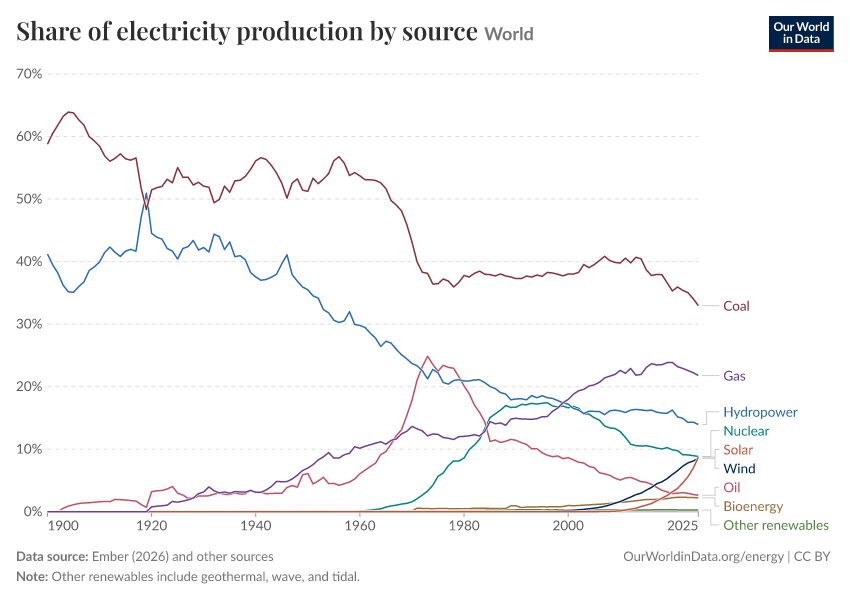
Electricity generation and sources

Electricity is just one component of primary energy use, which we looked at above. Globally, it’s around one-fifth of it.

Let’s zoom in on this part, then, to see how power generation compares across the world.

In the chart, you can explore total electricity generation in each country, how this compares per person, and what sources it’s generated from.

This data focuses on generation, not consumption. For most countries, the difference between the two is not huge. But for those that either rely heavily on imports or export a lot of electricity, this difference can be substantial.

From this data, we see that:

  • Global electricity generation is growing quickly; it has more than doubled this century. Almost all of this growth has come from Asia.
  • There are still large differences in electricity generation per person across the world: North America consumes almost twice the global average, and Europe also consumes far more per person than in other regions.
  • Over half of the world’s electricity still comes from fossil fuels, although this share is falling.
  • The share of global electricity generated by renewables has been increasing; they now account for around a third. Most of this growth has come from solar and wind.
  • There are huge differences in the share of electricity that comes from low-carbon sources. In some countries, nuclear and renewables produce almost all of the country’s power. In others, the contribution of these sources is minimal.

Research & Writing

December 10, 2020

The world’s energy problem

The world faces two energy problems: most of our energy still produces greenhouse gas emissions, and hundreds of millions lack access to energy.

Max Roser

Featured image

February 10, 2020

What are the safest and cleanest sources of energy?

Fossil fuels are the dirtiest and most dangerous energy sources, while nuclear and modern renewable energy sources are vastly safer and cleaner.

Hannah Ritchie

December 1, 2020

Why did renewables become so cheap so fast?

In most places, power from new renewables is now cheaper than new fossil fuels.

Max Roser

Overview Articles on Energy

September 20, 2019

Access to Energy

Hannah Ritchie, Pablo Rosado, and Max Roser

July 10, 2020

Energy Production and Consumption

Hannah Ritchie, Pablo Rosado, and Max Roser

July 10, 2020

Electricity Mix

Hannah Ritchie and Pablo Rosado

July 10, 2020

Energy Mix

Hannah Ritchie and Pablo Rosado

October 2, 2017

Fossil Fuels

Hannah Ritchie and Pablo Rosado

December 17, 2020

Renewable Energy

Hannah Ritchie, Max Roser, and Pablo Rosado

July 10, 2020

Nuclear Energy

Hannah Ritchie and Pablo Rosado

Energy Country Profiles

Hannah Ritchie, Pablo Rosado, and Max Roser

Energy Access and Consumption

Featured image

July 20, 2026

How much energy do data centers and artificial intelligence use?

Hannah Ritchie

July 5, 2021

Energy poverty and indoor air pollution: a problem as old as humanity that we can end within our lifetime

Max Roser

November 30, 2021

The number of people without electricity more than halved over the last 20 years

Hannah Ritchie

November 30, 2021

How many people do not have access to clean fuels for cooking?

Hannah Ritchie

November 30, 2021

Global comparison: how much energy do people consume?

Hannah Ritchie

December 1, 2021

The ‘Energy Ladder’: What energy sources do people on different incomes rely on?

Max Roser

Energy Sources and Transitions

Featured image

January 26, 2026

Could biofuels meet demand for global aviation?

Hannah Ritchie and Pablo Rosado

Featured image

January 12, 2026

Putting solar panels on land used for biofuels would produce enough electricity for all cars and trucks to go electric

Hannah Ritchie and Pablo Rosado

Thumbnail

February 26, 2024

Tracking global data on electric vehicles

Hannah Ritchie

November 5, 2021

Decarbonizing electricity is only one step towards a low-carbon energy system

Hannah Ritchie

December 1, 2021

How have the world’s energy sources changed over the last two centuries?

Hannah Ritchie

November 30, 2021

Is the world making progress in decarbonizing energy?

Hannah Ritchie

November 30, 2021

A number of countries have decoupled economic growth from energy use, even if we take offshored production into account

Hannah Ritchie

Thumbnail

December 7, 2021

How much energy do countries consume when we take offshoring into account?

Hannah Ritchie

November 5, 2021

Which countries get the most electricity from low-carbon sources?

Hannah Ritchie

November 4, 2021

When will countries phase out coal power?

Hannah Ritchie

Energy Prices and Impacts

Featured image

March 30, 2026

Battery costs have declined by 99% in the last three decades, making electrified transport a reality

Hannah Ritchie and Pablo Rosado

Featured image

February 16, 2026

Four minutes of air conditioning

Hannah Ritchie

A rectangular table with two rows and five columns. The first row contains colored blocks, starting from the left with a deep purple block, followed by a light purple, a pale lavender, and two shades of peach. The second row mirrors the first, repeating the same arrangement of colors.

January 27, 2025

How much in subsidies do fossil fuels receive?

Hannah Ritchie

Featured image

July 29, 2024

Air conditioning causes around 3% of greenhouse gas emissions. How will this change in the future?

Hannah Ritchie

December 1, 2020

Why did renewables become so cheap so fast?

Max Roser

June 16, 2022

How does the land use of different electricity sources compare?

Hannah Ritchie

Featured image

February 10, 2020

What are the safest and cleanest sources of energy?

Hannah Ritchie

Featured image

July 24, 2017

What was the death toll from Chernobyl and Fukushima?

Hannah Ritchie

More Key Articles on Energy

August 7, 2026

How primary energy is measured has changed across our charts

Hannah Ritchie and Pablo Rosado

November 8, 2021

Definition: Access to Electricity

Hannah Ritchie

November 8, 2021

Missing data on energy: our list of datasets that are needed but are not available

Hannah Ritchie, Pablo Rosado, and Max Roser

April 4, 2022

Primary, secondary, final, and useful energy: Why are there different ways of measuring energy?

Hannah Ritchie

Country Profiles

Explore the key metrics on energy for a country of your choice. How much energy is used overall? Which sources is it produced from? Is progress being made on decarbonizing the energy mix?

United KingdomUnited StatesChinaNigeriaIndiaBrazil

Key Charts on Energy

See all charts on this topic
  • A thumbnail of the "Electricity production from fossil fuels, nuclear and renewables" chartElectricity production from fossil fuels, nuclear and renewables
  • A thumbnail of the "Global primary energy use by source" chartGlobal primary energy use by sourceStacked area chart
  • A thumbnail of the "Share of electricity production by source" chartShare of electricity production by sourceIndividual sources
  • A thumbnail of the "Share of the population with access to electricity" chartShare of the population with access to electricity
  • A thumbnail of the "Changes in energy use vs. changes in GDP" chartChanges in energy use vs. changes in GDP
  • A thumbnail of the "Consumption-based energy intensity per dollar" chartConsumption-based energy intensity per dollar
  • A thumbnail of the "Consumption-based energy use per person" chartConsumption-based energy use per person
  • A thumbnail of the "Death rates per unit of electricity production" chartDeath rates per unit of electricity production
  • A thumbnail of the "Electricity as a share of primary energy" chartElectricity as a share of primary energy
  • A thumbnail of the "Electricity generation from fossil fuels, nuclear and renewables" chartElectricity generation from fossil fuels, nuclear and renewables
  • A thumbnail of the "Electricity production by source" chartElectricity production by sourceLine chart
  • A thumbnail of the "Energy embedded in traded goods as a share of domestic energy" chartEnergy embedded in traded goods as a share of domestic energy
  • A thumbnail of the "Energy imports and exports" chartEnergy imports and exports
  • A thumbnail of the "Energy intensity" chartEnergy intensityWorld Bank
  • A thumbnail of the "Energy intensity" chartEnergy intensity
  • A thumbnail of the "Energy intensity by sector" chartEnergy intensity by sector
  • A thumbnail of the "Fossil fuel consumption" chartFossil fuel consumptionBy type
  • A thumbnail of the "Fossil fuel consumption per capita by source" chartFossil fuel consumption per capita by sourceLine chart
  • A thumbnail of the "Gas consumption by region" chartGas consumption by region
  • A thumbnail of the "Global aviation demand, energy efficiency and CO₂ emissions" chartGlobal aviation demand, energy efficiency and CO₂ emissions
  • A thumbnail of the "Global installed renewable energy capacity by technology" chartGlobal installed renewable energy capacity by technology
  • A thumbnail of the "Hydropower generation by region" chartHydropower generation by region
  • A thumbnail of the "Installed geothermal energy capacity" chartInstalled geothermal energy capacity
  • A thumbnail of the "Installed solar energy capacity" chartInstalled solar energy capacity
  • A thumbnail of the "Installed wind energy capacity" chartInstalled wind energy capacity
  • A thumbnail of the "Levelized cost of energy for renewables" chartLevelized cost of energy for renewables
  • A thumbnail of the "Long-term energy transitions" chartLong-term energy transitions
  • A thumbnail of the "Natural gas production by region" chartNatural gas production by region
  • A thumbnail of the "Net energy embedded in traded goods" chartNet energy embedded in traded goods
  • A thumbnail of the "Number of people with and without electricity access" chartNumber of people with and without electricity access
  • A thumbnail of the "Number of people without access to electricity" chartNumber of people without access to electricityBy world region
  • A thumbnail of the "Number of people without access to electricity" chartNumber of people without access to electricityBy country
  • A thumbnail of the "Oil consumption by region" chartOil consumption by region
  • A thumbnail of the "Oil production by region" chartOil production by region
  • A thumbnail of the "People without clean fuels for cooking, by world region" chartPeople without clean fuels for cooking, by world region
  • A thumbnail of the "Per capita electricity generation by source" chartPer capita electricity generation by source
  • A thumbnail of the "Per capita electricity generation from fossil fuels, nuclear and renewables" chartPer capita electricity generation from fossil fuels, nuclear and renewables
  • A thumbnail of the "Per capita energy from fossil fuels, nuclear and renewables" chartPer capita energy from fossil fuels, nuclear and renewables
  • A thumbnail of the "Per capita primary energy use by source" chartPer capita primary energy use by source
  • A thumbnail of the "Primary energy from fossil fuels, nuclear, and renewables" chartPrimary energy from fossil fuels, nuclear, and renewables
  • A thumbnail of the "Primary energy use by source" chartPrimary energy use by sourceOver time
  • A thumbnail of the "Primary energy use by source" chartPrimary energy use by sourceBy country
  • A thumbnail of the "Production vs. consumption-based carbon intensity of energy" chartProduction vs. consumption-based carbon intensity of energy
  • A thumbnail of the "Production- vs. consumption-based energy use per person" chartProduction- vs. consumption-based energy use per person
  • A thumbnail of the "Production-based vs. consumption-based energy use" chartProduction-based vs. consumption-based energy use
  • A thumbnail of the "Renewable electricity generation by source" chartRenewable electricity generation by source
  • A thumbnail of the "Renewable energy" chartRenewable energy
  • A thumbnail of the "Renewable energy generation" chartRenewable energy generationLine chart
  • A thumbnail of the "Share of electricity generation from fossil fuels, renewables and nuclear" chartShare of electricity generation from fossil fuels, renewables and nuclear
  • A thumbnail of the "Share of electricity production by source" chartShare of electricity production by sourceFaceted
  • A thumbnail of the "Share of final energy use that comes from renewable sources" chartShare of final energy use that comes from renewable sources
  • A thumbnail of the "Share of global primary energy use by source" chartShare of global primary energy use by source
  • A thumbnail of the "Share of primary energy that comes from nuclear and renewables" chartShare of primary energy that comes from nuclear and renewables
  • A thumbnail of the "Share of primary energy use by source" chartShare of primary energy use by source
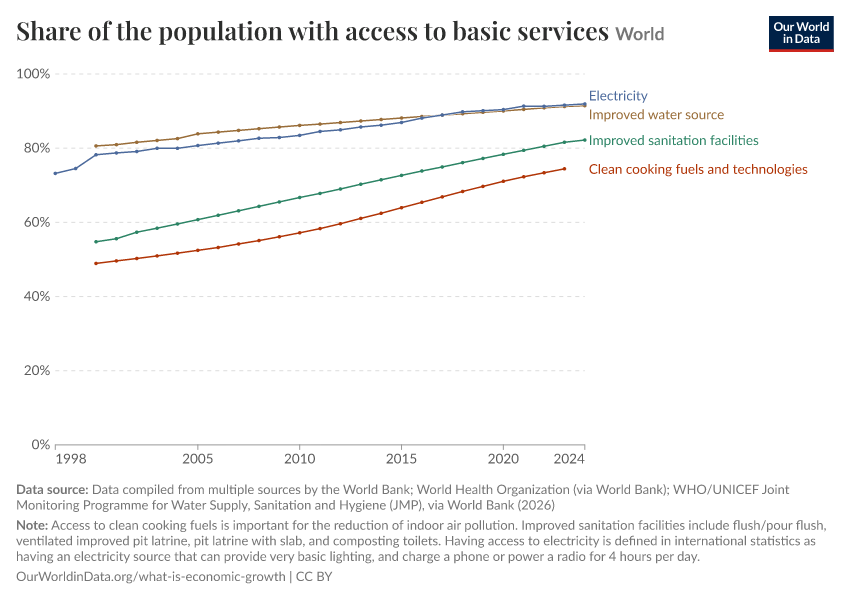
  • A thumbnail of the "Share of the population with access to basic services" chartShare of the population with access to basic services
  • A thumbnail of the "Solar (photovoltaic) panels cumulative capacity" chartSolar (photovoltaic) panels cumulative capacity
  • A thumbnail of the "Solar energy generation by region" chartSolar energy generation by region
  • A thumbnail of the "Solar photovoltaic module prices vs. cumulative capacity" chartSolar photovoltaic module prices vs. cumulative capacity
  • A thumbnail of the "Solar photovoltaic panel prices" chartSolar photovoltaic panel prices
  • A thumbnail of the "The long-term energy transition in Europe" chartThe long-term energy transition in Europe
  • A thumbnail of the "Wind energy generation by region" chartWind energy generation by region
  • A thumbnail of the "Access to clean fuels for cooking vs. per capita energy use" chartAccess to clean fuels for cooking vs. per capita energy use
  • A thumbnail of the "Access to electricity vs. GDP per capita" chartAccess to electricity vs. GDP per capita
  • A thumbnail of the "Annual patents filed for carbon capture and storage technologies" chartAnnual patents filed for carbon capture and storage technologies
  • A thumbnail of the "Annual patents filed for electric vehicle technologies" chartAnnual patents filed for electric vehicle technologies
  • A thumbnail of the "Annual patents filed for energy storage technologies" chartAnnual patents filed for energy storage technologies
  • A thumbnail of the "Annual patents filed for renewable energy technologies" chartAnnual patents filed for renewable energy technologies
  • A thumbnail of the "Annual patents filed in sustainable energy" chartAnnual patents filed in sustainable energy
  • A thumbnail of the "CO₂ emissions per capita vs. fossil fuel consumption per capita" chartCO₂ emissions per capita vs. fossil fuel consumption per capita
  • A thumbnail of the "CO₂ emissions per capita vs. share of electricity generation from renewables" chartCO₂ emissions per capita vs. share of electricity generation from renewables
  • A thumbnail of the "Changes in energy use vs. changes in GDP per capita" chartChanges in energy use vs. changes in GDP per capita
  • A thumbnail of the "Coal energy consumption per capita vs. GDP per capita" chartCoal energy consumption per capita vs. GDP per capita
  • A thumbnail of the "Coal prices" chartCoal prices
  • A thumbnail of the "Coal production and imports in the United Kingdom" chartCoal production and imports in the United KingdomTonnes
  • A thumbnail of the "Cobalt production" chartCobalt production
  • A thumbnail of the "Crude oil prices" chartCrude oil prices
  • A thumbnail of the "Crude oil spot prices" chartCrude oil spot prices
  • A thumbnail of the "Death rate from indoor air pollution vs. per capita energy use" chartDeath rate from indoor air pollution vs. per capita energy use
  • A thumbnail of the "Electricity production in the United Kingdom" chartElectricity production in the United Kingdom
  • A thumbnail of the "Energy intensity vs. GDP per capita" chartEnergy intensity vs. GDP per capita
  • A thumbnail of the "Energy use per capita vs. CO₂ emissions per capita" chartEnergy use per capita vs. CO₂ emissions per capita
  • A thumbnail of the "Energy use per person vs. GDP per capita" chartEnergy use per person vs. GDP per capita
  • A thumbnail of the "Explicit consumption subsidies for fossil fuels" chartExplicit consumption subsidies for fossil fuels
  • A thumbnail of the "Fossil fuel price index" chartFossil fuel price index
  • A thumbnail of the "GDP per capita vs. energy use" chartGDP per capita vs. energy use
  • A thumbnail of the "Global crude oil price vs. oil consumption" chartGlobal crude oil price vs. oil consumption
  • A thumbnail of the "Global electricity use for air conditioning" chartGlobal electricity use for air conditioning
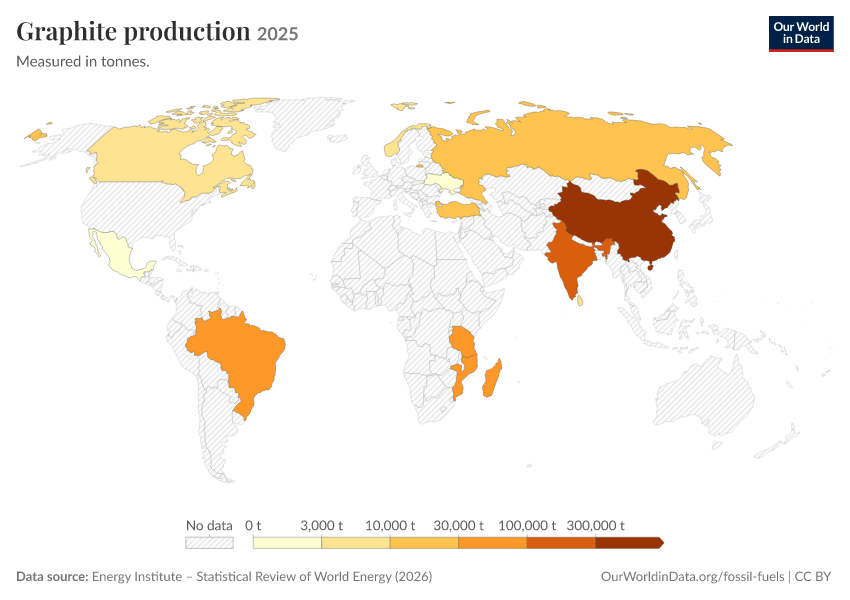
  • A thumbnail of the "Graphite production" chartGraphite production
  • A thumbnail of the "How have things changed?" chartHow have things changed?
  • A thumbnail of the "Hubbert's peak prediction vs. actual oil production in the United States" chartHubbert's peak prediction vs. actual oil production in the United States
  • A thumbnail of the "Hypothetical number of deaths from energy production" chartHypothetical number of deaths from energy production
  • A thumbnail of the "Investment in renewable energy, by technology" chartInvestment in renewable energy, by technology
  • A thumbnail of the "Kaya identity: drivers of CO₂ emissions" chartKaya identity: drivers of CO₂ emissions
  • A thumbnail of the "Lithium production" chartLithium production
  • A thumbnail of the "Natural gas prices" chartNatural gas prices
  • A thumbnail of the "Per capita CO₂ emissions by source" chartPer capita CO₂ emissions by source
  • A thumbnail of the "Per capita CO₂ emissions vs. per capita energy use" chartPer capita CO₂ emissions vs. per capita energy use
  • A thumbnail of the "Per capita electricity generation vs. GDP per capita" chartPer capita electricity generation vs. GDP per capita
  • A thumbnail of the "Per capita fossil energy consumption vs. GDP per capita" chartPer capita fossil energy consumption vs. GDP per capita
  • A thumbnail of the "Per capita low-carbon energy vs. GDP per capita" chartPer capita low-carbon energy vs. GDP per capita
  • A thumbnail of the "Renewable energy investment" chartRenewable energy investment
  • A thumbnail of the "Share of energy used in agriculture, forestry and fishing" chartShare of energy used in agriculture, forestry and fishing
  • A thumbnail of the "Share of primary energy that is low-carbon vs. GDP per capita" chartShare of primary energy that is low-carbon vs. GDP per capita
  • A thumbnail of the "Share of rural vs. urban population with electricity access" chartShare of rural vs. urban population with electricity access
  • A thumbnail of the "Share of schools with access to electricity" chartShare of schools with access to electricity
  • A thumbnail of the "Share with access to electricity vs. per capita energy use" chartShare with access to electricity vs. per capita energy use
  • A thumbnail of the "Solar energy generation vs. capacity" chartSolar energy generation vs. capacity
  • A thumbnail of the "The cost of 66 different technologies over time" chartThe cost of 66 different technologies over time
  • A thumbnail of the "When will countries phase out coal power?" chartWhen will countries phase out coal power?
  • A thumbnail of the "Wind energy generation vs. installed capacity" chartWind energy generation vs. installed capacity
  • A thumbnail of the "Year-to-year change in primary energy from fossil fuels vs. low-carbon energy" chartYear-to-year change in primary energy from fossil fuels vs. low-carbon energy
  • A thumbnail of the "Year-to-year change in primary energy use by source" chartYear-to-year change in primary energy use by source
  • A thumbnail of the "Year-to-year percentage change in primary energy use by source" chartYear-to-year percentage change in primary energy use by source
  • A thumbnail of the "Years of fossil fuel reserves left" chartYears of fossil fuel reserves left
Chart 1 of 114

Cite this work

Our articles and data visualizations rely on work from many different people and organizations. When citing this topic page, please also cite the underlying data sources. This topic page can be cited as:

Hannah Ritchie, Pablo Rosado, and Max Roser (2023) - “Energy” Published online at OurWorldinData.org. Retrieved from: 'https://ourworldindata.org/energy' [Online Resource]

BibTeX citation

@article{owid-energy,
    author = {Hannah Ritchie and Pablo Rosado and Max Roser},
    title = {Energy},
    journal = {Our World in Data},
    year = {2023},
    note = {https://ourworldindata.org/energy}
}
Our World in Data logo

Reuse this work freely

All visualizations, data, and articles produced by Our World in Data are completely open access under the Creative Commons BY license. You have the permission to use, distribute, and reproduce these in any medium, provided the source and authors are credited.

The data produced by third parties and made available by Our World in Data is subject to the license terms from the original third-party authors. We will always indicate the original source of the data in our documentation, so you should always check the license of any such third-party data before use and redistribution.

All of our charts can be embedded in any site.

You are visitor 01402503 — GeezerVison does not store the pages you look up.
Best viewed with Netscape Navigator 4.7 or Internet Explorer 6 at 800×600. No cookies required.