GV

GeezerVison

The World Wide Web, restored to 800 pixels of glory.

Home|About|Gaming cabinet|Archives|How it works|Starter sites

On this site

  • Our World in Data
  • Data
  • Latest
  • Donate

This view

  • Original page
  • New address

GeezerVison is showing ourworldindata.org — Our World in Data

Popular pages

  • CO₂ Emissions
  • Population Growth
  • Life Expectancy
  • Poverty
  • Impacts of Food
  • War & Peace
  • Global Education
  • Artificial Intelligence
  • Democracy

Research and data to make progress against the world’s largest problems.

Read about our mission
  • 14,040 charts
  • 126 topic pages
  • 27 data explorers
  • 507 articles
14,040 charts across 126 topics

All free: open access and openly licensed

A dark blue background with a lighter blue world map superimposed over it. Yellow text that says Migration by Our World in Data
New Topic update

We have updated our topic page on migration

How much of the population is international migrants, and how has this changed over time? Where do refugees move from, and where do they go?

Hannah Ritchie, Esteban Ortiz-Ospina, Tuna Acisu, and Simon van Teutem

Featured image
Article · 5 min read

Around half of people will experience a mental health issue in their lifetime

What is someone’s risk of developing depression, anxiety, or other mental health issues at some point in their life?

Hannah Ritchie

From our classics

The Spanish flu: the global impact of the largest influenza pandemic in history

The Spanish flu pandemic had a devastating impact on the global population.

Max Roser

Featured image
Article · 10 min read

How much development aid is spent on climate change?

Around one-fifth of development aid is spent on climate-related projects. But what does climate-related mean, and does it crowd out other aid projects?

Hannah Ritchie and Pablo Arriagada

A dark blue background with a lighter blue world map superimposed over it. Yellow text that says Migration by Our World in Data
New Topic update

We have updated our topic page on migration

How much of the population is international migrants, and how has this changed over time? Where do refugees move from, and where do they go?

Hannah Ritchie, Esteban Ortiz-Ospina, Tuna Acisu, and Simon van Teutem

From our classics

The Spanish flu: the global impact of the largest influenza pandemic in history

The Spanish flu pandemic had a devastating impact on the global population.

Max Roser

Featured image
Article · 5 min read

Around half of people will experience a mental health issue in their lifetime

What is someone’s risk of developing depression, anxiety, or other mental health issues at some point in their life?

Hannah Ritchie

Featured image
Article · 10 min read

How much development aid is spent on climate change?

Around one-fifth of development aid is spent on climate-related projects. But what does climate-related mean, and does it crowd out other aid projects?

Hannah Ritchie and Pablo Arriagada

Updates and announcements

  • Data update · Yesterday

    What does poverty look like beyond income?

    Explore updated data on multidimensional poverty from OPHI and the UN Development Programme.

    Read more
  • Data update · 8 days ago

    Which vaccines do children around the world receive?

    Explore updated data on vaccination coverage from the World Health Organization and UNICEF.

    Read more
  • Data update · 15 days ago

    Tracking who trades with whom around the world

    Explore updated data on trade between countries from the International Monetary Fund.

    Read more
See all updatesSubscribe to our newsletters

Subscribe to our newsletters

Receive our latest work by email
See example OWID Brief newsletter
See example Data Insights newsletter
By subscribing you are agreeing to the terms of our privacy policy.

Follow us

  • X
  • Instagram
  • Threads
  • Facebook
  • LinkedIn
  • Bluesky
  • GitHub

We are a non-profit — all our work is free to use and openly licensed.

Donate to support us
See all Data Insights
  • Bar chart of the remaining CO₂ emissions budget for a 50% chance of staying below 1.5°C, 1.7°C and 2°C, where the budget for 1.5°C (150 billion tonnes) equals only 3.5 years of current emissions, compared with 12 years for 1.7°C and 24 years for 2°C. Projected 2026 emissions are 43 billion tonnes, so the 1.5°C budget would be exhausted within 4 years and the 2°C budget by 2051. Data sources: IPCC AR6 WG1; Forster et al. (2026); Global Carbon Project (2026). License: CC BY to Our World in Data.

    Today

    How much CO2 can the world emit while limiting global temperature rise?

    Hannah Ritchie and Pablo Rosado

    In 2015, countries worldwide signed the Paris Agreement, aiming to keep the global temperature rise “well below 2°C” and to limit it to 1.5°C.

    To meet these targets, there are limits to the amount of carbon dioxide (CO2) that can be emitted. These are called carbon budgets. Every year we emit more CO2, these budgets shrink.

    In the chart, you can see estimates for how much CO2 the world can emit while staying below different levels of warming. This is based on a 50% likelihood of staying below it; if we wanted to guarantee we wouldn’t exceed these temperatures, our budget would be much smaller.

    For perspective, we’ve compared each budget with the projected amount of CO2 that the world is expected to emit in 2026. This tells us how many years we have left if emissions stay at their current levels.

    At current emission rates, the 1.5°C budget would run out around 2030. It seems implausible that global emissions will fall quickly enough to avoid this.

    The 2°C budget would last until mid-century. By taking action on climate change, we buy ourselves more time and can avoid this level of warming.

    This is based on the latest estimates from the Global Carbon Project. See how emissions are changing in your country
  • Line chart of global fossil CO₂ emissions from 1960 to 2026 where emissions rise from about 9 billion tonnes to a projected 38.2 billion tonnes in 2026, a 0.4% decline from 2025. The long-term climb is interrupted only by brief dips, including a sharp one in 2020. Source: Global Carbon Budget (2026), with 2026 a preliminary estimate. License: CC BY to Our World in Data.

    November 10

    Global CO2 emissions from fossil fuels are set to fall in 2026

    Hannah Ritchie and Pablo Rosado

    Global carbon dioxide (CO2) emissions from fossil fuels are projected to fall by around 0.4% in 2026. This is based on the latest preliminary estimates from the Global Carbon Project, published today.

    This is a small reduction within an overall upward trend. Emissions have grown more slowly over the past decade than in previous decades, but they have not yet peaked or begun a consistent decline.

    This fall mostly came from a reduction in oil consumption and a small decline in gas. Coal use increased slightly.

    Among the major emitters, emissions are projected to fall in China, the United States, the European Union, and Japan. But they’re expected to increase by around 4% in India.

    Why did emissions fall? The authors cite three key factors.

    The deployment of clean energy (particularly solar and wind) displaced some fossil fuel use that would have otherwise been required to meet growing energy demand. Electric vehicles also reduced oil demand. Finally, the war in Iran and its impact on oil prices led to reduced demand, which has inadvertently reduced emissions.

    Emissions from land-use change are more uncertain but are projected to increase this year due to peat fires and forest degradation in Southeast Asia.

    Explore new estimates for all countries for 2025, measured in total, per capita, and historical terms
  • Stacked area chart of global coal consumption, split between China and the rest of the world, from 1965 to 2025, where China now burns more coal than the rest of the world combined. Global use rose from about 16,000 TWh to over 45,000 TWh, and nearly all of that growth came from China after 2000, while the rest of the world stayed roughly flat at around 15,000 to 22,000 TWh. Source: Energy Institute, Statistical Review of World Energy (2026). License: CC BY to Our World in Data.

    November 7

    Almost all the growth in global coal use since the late 1980s has come from China

    Max Roser

    Outside China, the world’s use of coal has barely changed since the late 1980s. It was just over 20,000 terawatt-hours back then, and almost four decades later, it is still the same.

    But the change has been very different in China. The country has increased the use of coal enormously, and today, China is burning more coal than the rest of the world combined.

    The future of global coal use, and the emissions that come with it, depends heavily on what happens in China.

    How much deadlier and dirtier is coal than the alternatives? Find out in our article on the safest and cleanest sources of energy
  • Line chart of reported annual cancer death rates per 100,000 people in Chile where crude rates increase from 102 to 151 between 1980 to 2022 while age-adjusted rates fall from 146 to 98, illustrating the effect of population aging. The chart highlights divergent trends: rising crude deaths but falling age-adjusted deaths. Data source: WHO Mortality Database (2025). License: CC BY.

    November 5

    Population aging is pushing up Chile’s crude cancer death rate, even as age-adjusted rates are falling

    Esteban Ortiz-Ospina

    In Chile, the annual number of cancer deaths as a share of the total population has been rising for decades. From this, it would be easy to assume that cancer is getting worse. But the chances of dying from cancer at most ages are lower than they used to be. The missing piece is that the country’s population is changing quickly, and older people now make up a much larger share.

    That’s what the chart shows. The crude cancer death rate, in red, counts registered cancer deaths per 100,000 people of all ages. This metric has been going up, reflecting the fact that cancer risks increase steeply with age, and the population has grown much older.

    The blue line, by contrast, shows the age-adjusted rate. This metric removes the effect of aging by holding the age structure constant.

    This line has been falling for decades, which means that Chileans at almost every age are now less likely to die from cancer than people of the same age were in the past.

    The pattern we see in Chile is happening in many other countries, too, and is visible in the global estimates.

    Explore this same comparison country by country in our interactive chart
  • Line chart of the share of Poland's electricity generated from coal and from solar and wind, 1985 to 2025, where coal's share fell from 71% in 2021 to 50% in 2025 while solar and wind more than doubled from 11% to 25%. Coal has dominated for decades, at over 95% in the 1980s and 1990s, and solar and wind were near zero until about 2010. Data source: Ember (2026); Energy Institute (2026). License: CC BY to Our World in Data.

    November 3

    Solar and wind power have grown quickly in Poland, but coal still dominates

    Hannah Ritchie and Pablo Arriagada

    The share of electricity produced by solar and wind in Poland more than doubled in just four years. In 2021, these renewable sources produced just 11% of its power; by 2025, this had risen to 25%.

    You can see this growth in the chart, based on electricity data from Ember.

    Solar and wind output, combined, grew very little in 2025, due to weak wind conditions. Solar output continued to grow, but it was barely enough to offset the decline in wind power.

    Poland still has one of the most coal-intensive electricity mixes in Europe, with coal producing 50% of its power. The country has committed to moving away from it in the next few decades; growth in solar and wind generation will play a key role in this.

    Explore energy sources across the world in our charts
  • Stacked bar chart of projected 2025 population age shares (under 15, 15 to 64 years old, older than 65) where it contrasts very young and very old populations — the Central African Republic is shown with 49% under 15 and 2% older than 65, the global average is 25% under 15 and 10% older than 65, and Japan is shown with 11% under 15 and 30% older than 65. Source: UN, World Population Prospects (2024). License: CC BY to Our World in Data.

    October 31

    One in ten people in the world is over 65 — how does this compare in the youngest and oldest countries?

    Hannah Ritchie

    One in four people in the world is younger than 15. Just one in ten is 65 or older.

    But there are huge differences in this distribution across countries. In the chart, I’ve shown these global figures alongside the country with the largest share of children, the Central African Republic, and the one with the largest share of older people, Japan.

    In the Central African Republic, half of the population is under 15. Being over 65 is pretty rare: just 2% of the population.

    Japan is the opposite. Being a child or adolescent puts you in the minority. Almost one-third of the population is 65 and older, and that share is growing quickly.

    These differences in age distribution matter a lot for a country’s infrastructure, socioeconomic conditions, and public spending — from pensions and healthcare to childcare and education.

    See how the age distribution of your own country compares to others across the world
  • Set of twelve scatter plots of country-level health, education, and living-standard indicators plotted against GDP per capita. The plots show that child mortality, stillbirths, maternal deaths, and hunger are lower where GDP per capita is higher, while doctors, life expectancy, literacy, years in education, test scores, electricity, clean water, and life satisfaction are higher where GDP per capita is higher. Data sources: UN IGME, UN MMEIG, WHO/UNICEF, UN WPP, UNESCO, UNDP, Gallup, World Bank. License: CC BY to Our World in Data.

    October 29

    How is life at different levels of GDP per capita?

    Max Roser

    The chart shows the relationship between GDP (gross domestic product) per capita — a measure of average incomes in a country — and people’s living conditions.

    Where GDP per capita is higher, living conditions are far better in many ways. Where average incomes are higher, children die less often, fewer of them are born dead, mothers die less often, fewer children suffer from hunger, doctors can focus on fewer patients, people live longer, more people can read, children have better access to education and better learning outcomes, more people have access to electricity and clean drinking water, and people are happier with their lives.

    The disparity between countries with a low and a high GDP per capita is enormous. Looking at the first panel, for example, you can see that a child born in one of the poorest countries is more than 20 times as likely to die as a child born in one of the richest.

    In my article “What is growth?”, I have written about why a high GDP per capita is so important for our living standards and how economic growth is possible
  • See all our Data Insights
See all our data

Child mortality rate Long-run estimates combining data from un & gapminder

What share of children die before their fifth birthday?

What could be more tragic than the death of a young child? Child mortality, the death of children under the age of five, is still extremely common in our world today.

The historical data makes clear that it doesn’t have to be this way: it is possible for societies to protect their children and reduce child mortality to very low rates. For child mortality to reach low levels, many things have to go right at the same time: good healthcare, good nutrition, clean water and sanitation, maternal health, and high living standards. We can, therefore, think of child mortality as a proxy indicator of a country’s living conditions.

The chart shows our long-run data on child mortality, which allows you to see how child mortality has changed in countries around the world.

Explore the data
Explore the data

Share of population living in extreme poverty World Bank
Share of population living in extreme poverty World bank

What share of the population lives in extreme poverty?

The UN sets the “International Poverty Line” as a worldwide comparable definition for extreme poverty. Extreme poverty is currently defined as living on less than $3 per day. This indicator, published by the World Bank, has successfully drawn attention to the terrible depths of poverty of the poorest people in the world.

Two centuries ago, the majority of the world’s population was extremely poor. Back then, it was widely believed that widespread poverty was inevitable. This turned out to be wrong. Economic growth is possible and makes it possible for entire societies to leave the deep poverty of the past behind. Whether or not countries are leaving the worst poverty behind can be monitored by relying on this indicator.

Explore the data
Explore the data

Life expectancy Long-run estimates collated from multiple sources by Our World in Data
Life expectancy Long-run estimates collated from multiple sources by our world in data

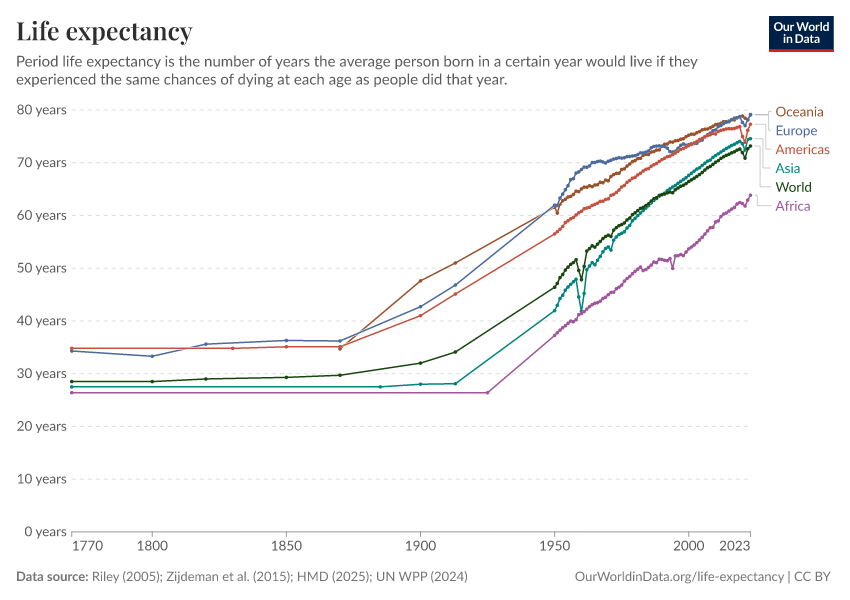
How has people’s life expectancy changed over time?

Across the world, people are living longer. In 1900, the global average life expectancy of a newborn was 32 years. By 2021, this had more than doubled to 71 years.

Big improvements were achieved by countries around the world. The chart shows that life expectancy has more than doubled in every region of the world. This improvement is not only due to declining child mortality; life expectancy increased at all ages.

This visualization shows long-run estimates of life expectancy brought together by our team from several different data sources. It also shows that the COVID-19 pandemic led to reduced life expectancy worldwide.

Explore the data
Explore the data

CO₂ emissions per capita Long-run estimates from the Global Carbon Budget
CO₂ emissions per capita Long-run estimates from the global carbon budget

How have CO₂ emissions per capita changed?

The main source of carbon dioxide (CO2) emissions is the burning of fossil fuels. It is the primary greenhouse gas causing climate change.

Globally, CO2 emissions have remained at just below 5 tonnes per person for over a decade. Between countries, however, there are large differences, and while emissions are rapidly increasing in some countries, they are rapidly falling in others.

The source for this CO2 data is the Global Carbon Budget, a dataset we update yearly as soon as it is published. In addition to these production-based emissions, they publish consumption-based emissions for the last three decades, which can be viewed in our Greenhouse Gas Emissions Data Explorer.

Explore the data
Explore the data

GDP per capita Long-run estimates from the Maddison Project Database
GDP per capita Long-run estimates from the maddison project database

How do average incomes compare between countries around the world?

GDP per capita is a very comprehensive measure of people’s average income. This indicator reveals how large the inequality between people in different countries is. In the poorest countries, people live on less than $1,000 per year, while in rich countries, the average income is more than 50 times higher.

The data shown is sourced from the Maddison Project Database. Drawing together the careful work of hundreds of economic historians, the particular value of this data lies in the historical coverage it provides. This data makes clear that the vast majority of people in all countries were poor in the past. It allows us to understand when and how the economic growth that made it possible to leave the deep poverty of the past behind was achieved.

Explore the data
Explore the data

Share of people who are undernourished UN FAO
Share of people who are undernourished Un fao

What share of the population is suffering from hunger?

Hunger has been a severe problem for most of humanity throughout history. Growing enough food to feed one’s family was a constant struggle in daily life. Food shortages, malnutrition, and famines were common around the world.

The UN’s Food and Agriculture Organization publishes global data on undernourishment, defined as not consuming enough calories to maintain a normal, active, healthy life. These minimum requirements vary by a person’s sex, weight, height, and activity levels. This is considered in these national and global estimates.

The world has made much progress in reducing global hunger in recent decades. But we are still far away from an end to hunger, as this indicator shows. Tragically, nearly one in ten people still do not get enough food to eat and in recent years — especially during the pandemic — hunger levels have increased.

Explore the data
Explore the data

Literacy rate Long-run estimates collated from multiple sources by Our World in Data
Literacy rate Long-run estimates collated from multiple sources by our world in data

When has literacy become a widespread skill?

Literacy is a foundational skill. Children need to learn to read so that they can read to learn. When we fail to teach this foundational skill, people have fewer opportunities to lead the rich and interesting lives that a good education offers.

The historical data shows that only a very small share of the population, a tiny elite, was able to read and write. Over the course of the last few generations, literacy levels increased, but it remains an important challenge for our time to provide this foundational skill to all.

At Our World in Data, we investigated the strengths and shortcomings of the available data on literacy. Based on this work, our team brought together the long-run data shown in the chart by combining several different sources, including historical and recent UNESCO data and a range of research publications.

Explore the data
Explore the data

Share of the population with access to electricity World Bank
Share of the population with access to electricity World bank

Where do people lack access to even the most basic electricity supply?

Light at night makes it possible to get together after sunset; mobile phones allow us to stay in touch with those far away; the refrigeration of food reduces food waste; and household appliances free up time from household chores. Access to electricity improves people’s living conditions in many ways.

The World Bank data on the world map captures whether people have access to the most basic electricity supply — just enough to provide basic lighting and charge a phone or power a radio for 4 hours per day.

It shows that, especially in several African countries, a large share of the population lacks the benefits that basic electricity offers. No radio and no light at night.

Explore the data
Explore the data

Data explorers

See all our Data Explorers

Interactive visualization tools to explore a wide range of related indicators.

  • Icon for topic Poverty

    Poverty

    Data Explorer

  • Icon for topic Population and Demographic Change

    Population & Demography

    Data Explorer

  • Icon for topic Global Health

    Global Health

    Data Explorer

  • Icon for topic Energy

    Energy mix

    Data Explorer

All our topics

All our data, research, and writing — topic by topic.

Population and Demographic Change

  • Population Growth
  • Age Structure
  • Gender Ratio
  • Life Expectancy
  • Fertility Rate
  • Child & Infant Mortality
  • Urbanization
  • Migration

Health

  • Global Health
  • Causes of Death
  • Child & Infant Mortality
  • Burden of Disease
  • Life Expectancy
  • Mental Health
  • Suicides
  • Cardiovascular Diseases
  • Cancer
  • Maternal Mortality
  • Air Pollution
  • Outdoor Air Pollution
  • Indoor Air Pollution
  • Lead Pollution
  • Alcohol Consumption
  • Illicit Drug Use
  • Obesity
  • Smoking
  • Pandemics
  • COVID-19
  • Malaria
  • HIV/AIDS
  • Diarrheal Diseases
  • Tuberculosis
  • Polio
  • Neglected Tropical Diseases
  • Influenza
  • Pneumonia
  • Tetanus
  • Mpox (monkeypox)
  • Smallpox
  • Eradication of Diseases
  • Vaccination
  • Antibiotics & Antibiotic Resistance
  • Healthcare Spending

Energy and Environment

  • Climate Change
  • CO2 & Greenhouse Gas Emissions
  • Air Pollution
  • Outdoor Air Pollution
  • Indoor Air Pollution
  • Ozone Layer
  • Energy
  • Access to Energy
  • Energy Mix
  • Fossil Fuels
  • Nuclear Energy
  • Bioenergy and Biofuels
  • Renewable Energy
  • Metals & Minerals
  • Natural Disasters
  • Biodiversity
  • Environmental Impacts of Food Production
  • Fish & Overfishing
  • Animal Welfare
  • Land Use
  • Water Use & Stress
  • Forests & Deforestation
  • Wildfires
  • Plastic Pollution
  • Oil Spills
  • Lead Pollution
  • Waste Management
  • Clean Water & Sanitation
  • Clean Water
  • Sanitation
  • Electricity Mix

Food and Agriculture

  • Agricultural Production
  • Meat & Dairy Production
  • Fish & Overfishing
  • Crop Yields
  • Animal Welfare
  • Environmental Impacts of Food Production
  • Farm Size
  • Land Use
  • Fertilizers
  • Pesticides
  • Employment in Agriculture
  • Hunger & Undernourishment
  • Food Supply
  • Food Prices
  • Obesity
  • Famines
  • Diet Compositions
  • Micronutrient Deficiency
  • Human Height
  • Bioenergy and Biofuels

Poverty and Economic Development

  • Poverty
  • Economic Growth
  • Economic Inequality
  • Foreign Aid
  • Economic Inequality by Gender
  • Government Spending
  • State Capacity
  • Taxation
  • Corruption
  • Healthcare Spending
  • Education Spending
  • Military Personnel & Spending
  • Work & Employment
  • Women's Employment
  • Working Hours
  • Trade & Globalization
  • Migration
  • Tourism
  • Clean Water & Sanitation
  • Clean Water
  • Sanitation

Education and Knowledge

  • Global Education
  • Literacy
  • Education Spending
  • Research & Development
  • Internet
  • Books

Innovation and Technological Change

  • Technological Change
  • Research & Development
  • Artificial Intelligence
  • Internet
  • Space Exploration & Satellites
  • Transport
  • Medicine & Biotechnology

Living Conditions, Community and Wellbeing

  • Homelessness
  • Access to Energy
  • Indoor Air Pollution
  • Clean Water & Sanitation
  • Clean Water
  • Sanitation
  • Light at Night
  • Time Use
  • Working Hours
  • Marriages & Divorces
  • Loneliness & Social Connections
  • Trust
  • Happiness & Life Satisfaction
  • Religion

Human Rights and Democracy

  • Human Rights
  • Democracy
  • State Capacity
  • Women's Rights
  • LGBT+ Rights
  • Corruption
  • Economic Inequality by Gender
  • Child Labor
  • Violence Against Children & Children's Rights

Violence and War

  • War & Peace
  • Nuclear Weapons
  • Homicides
  • Terrorism
  • State Capacity
  • Military Personnel & Spending
  • Violence Against Children & Children's Rights

Our World in Data is free and accessible for everyone.

Help us do this work by making a donation.

Donate now
You are visitor 01402503 — GeezerVison does not store the pages you look up.
Best viewed with Netscape Navigator 4.7 or Internet Explorer 6 at 800×600. No cookies required.