GV

GeezerVison

The World Wide Web, restored to 800 pixels of glory.

Home|About|Gaming cabinet|Archives|How it works|Starter sites

On this site

  • Our World in Data
  • Data
  • Latest
  • Donate
  • Saloni Dattani
  • Lucas Rodés-Guirao
  • Edouard Mathieu
  • Hannah Ritchie
  • Max Roser

This view

  • Original page
  • New address

GeezerVison is showing ourworldindata.org — Pandemics

Disease outbreaks may be inevitable, but large-scale pandemics are not. The world can respond swiftly and effectively to pandemic risks in the future with better understanding, resources, and effort.

To avoid suffering through another large pandemic, we have to take the risk of pandemics seriously. Despite warnings that another one was likely, the COVID-19 pandemic killed more than 27 million people.1

We must build the capacity to test for pathogens and understand them: which pathogens put us at the greatest risk, how they spread, and how to tackle them.

We know it is possible to greatly reduce the risk of infectious disease. We’ve learned over history how to reduce their impact with vaccines, public health efforts, and medicine.

In addition to the old risks, we face new threats from factory farming, genetic modification, climate change, and antimicrobial resistance. With more attention and effort, we can reduce their risks too.

On this page, we show data and research on pandemics in history and how we can reduce their risk in the future.

Related Topics

  • COVID-19
  • Influenza
  • HIV/AIDS
  • Smallpox
  • Vaccination

Research & Writing

Thumbnail for article battle against microbes

July 20, 2020

Our history is a battle against the microbes: we lost terribly before science, public health, and vaccines allowed us to protect ourselves

For most of history, we were losing the battle against microbes. Vaccines were one of the breakthroughs that turned it around.

Max Roser

Thumbnail image for article on historical pandemics

December 7, 2023

What were the death tolls from pandemics in history?

Pandemics have killed millions of people throughout history. How many deaths were caused by different pandemics, and how have researchers estimated their death tolls?

Saloni Dattani

Articles on pandemics in history

March 4, 2020

The Spanish flu: the global impact of the largest influenza pandemic in history

Max Roser

A dark blue background with a lighter blue world map superimposed over it. Yellow text that says Smallpox by Our World in Data

June 28, 2018

Smallpox

Sophie Ochmann, Saloni Dattani, and Max Roser

A line graph with three distinct colored lines representing different data sets over a period. No scale or other text is shown.

November 26, 2020

Breaking out of the Malthusian trap: How pandemics allow us to understand why our ancestors were stuck in poverty

Max Roser

December 1, 2019

Antiretroviral therapy has saved millions of lives from AIDS and could save more

Bernadeta Dadonaite

Articles on pandemic risks

October 20, 2022

How many people die from the flu?

Saloni Dattani and Fiona Spooner

November 18, 2017

How new vaccines can help with our antibiotic dependence

Samantha Vanderslott

Articles on COVID-19

November 23, 2021

How do death rates from COVID-19 differ between people who are vaccinated and those who are not?

Edouard Mathieu and Max Roser

May 22, 2020

Excess mortality during the Coronavirus pandemic (COVID-19)

Edouard Mathieu, Hannah Ritchie, Lucas Rodés-Guirao, Cameron Appel, Daniel Gavrilov, Charlie Giattino, Joe Hasell, Bobbie Macdonald, Saloni Dattani, Diana Beltekian, Esteban Ortiz-Ospina, and Max Roser

Data explorers on pandemics

COVID-19 Data Explorer

Our World in Data

May 18, 2023

Influenza

Saloni Dattani, Fiona Spooner, Hannah Ritchie, and Max Roser

May 24, 2022

Mpox

Edouard Mathieu, Fiona Spooner, Saloni Dattani, Hannah Ritchie, and Max Roser

Global Health Data Explorer

Our World in Data

Key Charts on Pandemics

See all charts on this topic
  • A thumbnail of the "Historical trends across infectious diseases" chartHistorical trends across infectious diseases
  • A thumbnail of the "Number of one-year-olds who have received different vaccinations" chartNumber of one-year-olds who have received different vaccinations
  • A thumbnail of the "Respiratory death rate from seasonal influenza, age 65+" chartRespiratory death rate from seasonal influenza, age 65+
  • A thumbnail of the "Estimated cumulative excess deaths during COVID-19" chartEstimated cumulative excess deaths during COVID-19Non-Explorer, single-entity version
  • A thumbnail of the "Cholera reported deaths" chartCholera reported deaths
  • A thumbnail of the "Incidence and prevalence of extensively drug-resistant tuberculosis" chartIncidence and prevalence of extensively drug-resistant tuberculosis
  • A thumbnail of the "Antibiotic usage in livestock per kilogram of meat" chartAntibiotic usage in livestock per kilogram of meat
  • A thumbnail of the "COVID-19 vaccination coverage worldwide" chartCOVID-19 vaccination coverage worldwide
  • A thumbnail of the "Daily confirmed COVID-19 cases by world region" chartDaily confirmed COVID-19 cases by world regionStacked area chart – by world region
  • A thumbnail of the "H5N1 influenza: monthly reported cases" chartH5N1 influenza: monthly reported cases
  • A thumbnail of the "HIV funding and estimated future requirements" chartHIV funding and estimated future requirements
  • A thumbnail of the "HIV funding in low- and middle-income countries, by region" chartHIV funding in low- and middle-income countries, by region
  • A thumbnail of the "HIV/AIDS deaths averted by antiretroviral therapy" chartHIV/AIDS deaths averted by antiretroviral therapy
  • A thumbnail of the "Imports of personal protective equipment per capita" chartImports of personal protective equipment per capita
  • A thumbnail of the "Malaria deaths by world region" chartMalaria deaths by world regionWHO
  • A thumbnail of the "Paralytic polio: estimated cases by world region" chartParalytic polio: estimated cases by world region
  • A thumbnail of the "Share of the population living with HIV" chartShare of the population living with HIVUNAIDS
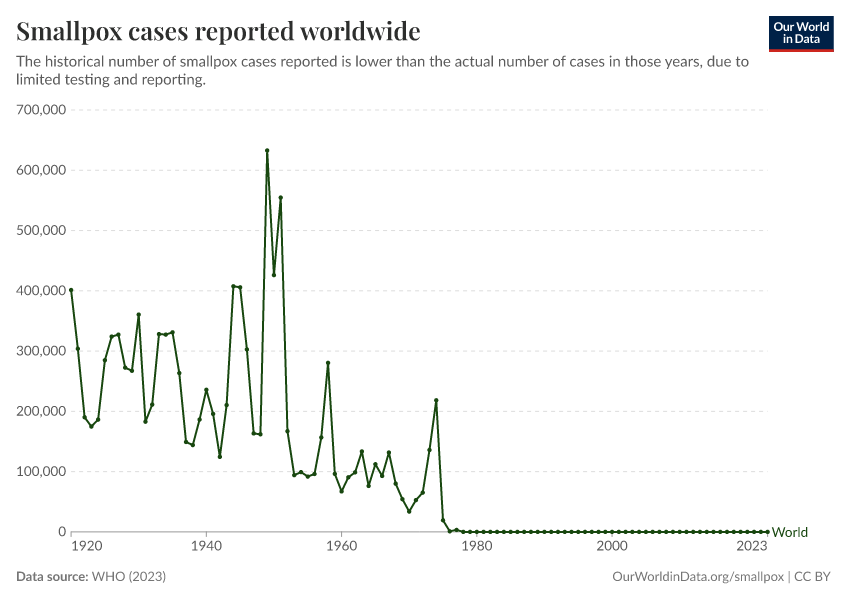
  • A thumbnail of the "Smallpox cases reported worldwide" chartSmallpox cases reported worldwide
  • A thumbnail of the "Smallpox deaths as a share of all deaths in London" chartSmallpox deaths as a share of all deaths in London1629 to 1902
  • A thumbnail of the "Smallpox: when was it eliminated in each country?" chartSmallpox: when was it eliminated in each country?
Chart 1 of 20

Endnotes

  1. This comes from the central estimate of excess mortality published by The Economist by the time of publication, December 2023.

    Solstad S. The pandemic’s true death toll. Economist 2021;20. https://www.economist.com/graphic-detail/coronavirus-excess-deaths-tracker (10 October 2022, date last accessed). See also: https://www.economist.com/graphic-detail/2021/05/13/how-we-estimated-the-true-death-toll-of-the-pandemic

Cite this work

Our articles and data visualizations rely on work from many different people and organizations. When citing this topic page, please also cite the underlying data sources. This topic page can be cited as:

Saloni Dattani, Lucas Rodés-Guirao, Edouard Mathieu, Hannah Ritchie, and Max Roser (2023) - “Pandemics” Published online at OurWorldinData.org. Retrieved from: 'https://ourworldindata.org/pandemics' [Online Resource]

BibTeX citation

@article{owid-pandemics,
    author = {Saloni Dattani and Lucas Rodés-Guirao and Edouard Mathieu and Hannah Ritchie and Max Roser},
    title = {Pandemics},
    journal = {Our World in Data},
    year = {2023},
    note = {https://ourworldindata.org/pandemics}
}
Our World in Data logo

Reuse this work freely

All visualizations, data, and articles produced by Our World in Data are completely open access under the Creative Commons BY license. You have the permission to use, distribute, and reproduce these in any medium, provided the source and authors are credited.

The data produced by third parties and made available by Our World in Data is subject to the license terms from the original third-party authors. We will always indicate the original source of the data in our documentation, so you should always check the license of any such third-party data before use and redistribution.

All of our charts can be embedded in any site.

You are visitor 01402503 — GeezerVison does not store the pages you look up.
Best viewed with Netscape Navigator 4.7 or Internet Explorer 6 at 800×600. No cookies required.