GeezerVisonThe World Wide Web, restored to 800 pixels of glory. | ||||||||||||||||||||||||||||||||||||||||||||||||||||||||||||||||||||||||||||||||||||||||||||||||||||||||||||||||||||||||||||||||||||||||||||||||||||||||||||||||||||||||||||||||||||||||||||||||||||||||||||||||||||||||||||||||||||||||||||||||||||||||||||||||||||||||||||||||||||||||||||||||||||||||||||||||||||||||||||||||||||||||||||||||||||||||||||||||||||||||||||||||||||||||||||||||||||||
| Home|About|Gaming cabinet|Archives|How it works|Starter sites | ||||||||||||||||||||||||||||||||||||||||||||||||||||||||||||||||||||||||||||||||||||||||||||||||||||||||||||||||||||||||||||||||||||||||||||||||||||||||||||||||||||||||||||||||||||||||||||||||||||||||||||||||||||||||||||||||||||||||||||||||||||||||||||||||||||||||||||||||||||||||||||||||||||||||||||||||||||||||||||||||||||||||||||||||||||||||||||||||||||||||||||||||||||||||||||||||||||||
GeezerVison is showing pbpython.com — Understanding the Transform Function in Pandas - Practical Business Python 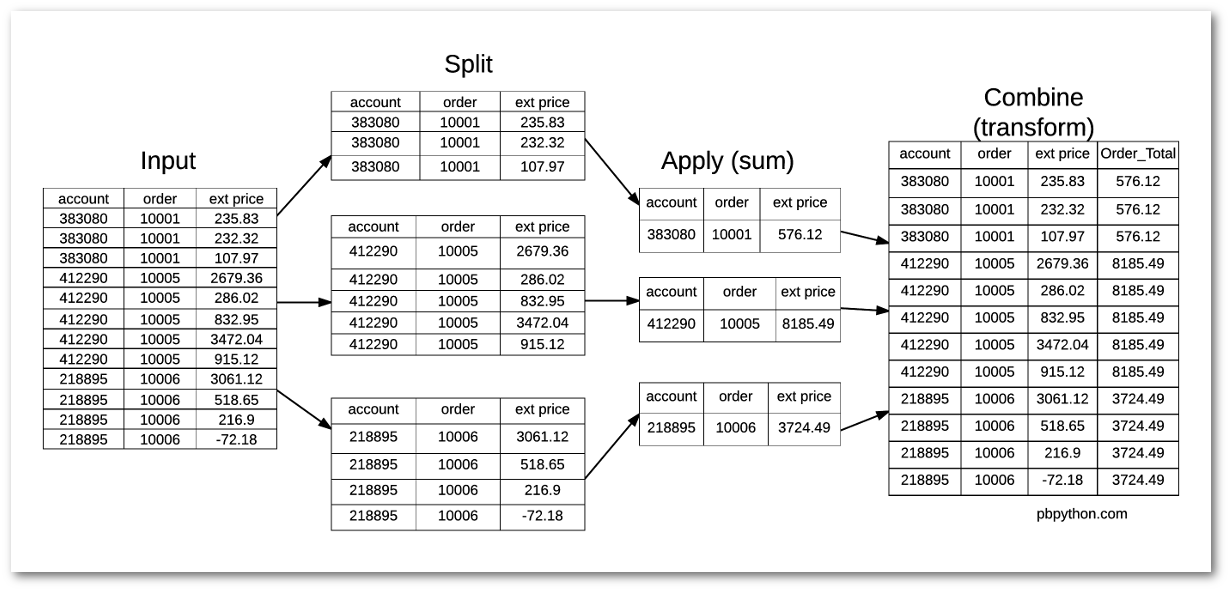
IntroductionOne of the compelling features of pandas is that it has a rich library of methods for manipulating
data. However, there are times when it is not clear what the various functions
do and how to use them. If you are approaching a problem from an Excel mindset,
it can be difficult to translate the planned solution into the unfamiliar pandas command.
One of those “unknown” functions is the What is transform?I have found the best coverage of this topic in Jake VanderPlas’ excellent Python Data Science Handbook. I plan to write a review on this book in the future but the short and sweet is that it is a great resource that I highly recommend. As described in the book, While aggregation must return a reduced version of the data, transformation can return some transformed version of the full data to recombine. For such a transformation, the output is the same shape as the input. A common example is to center the data by subtracting the group-wise mean. With that basic definition, I will go through another example that can explain how this is useful in other instances outside of centering data. Problem SetFor this example, we will analyze some fictitious sales data. In order to keep the dataset small, here is a sample of 12 sales transactions for our company:
You can see in the data that the file contains 3 different orders (10001, 10005 and 10006) and that each order consists has multiple products (aka skus). The question we would like to answer is: “What percentage of the order total does each sku represent?” For example, if we look at order 10001 with a total of $576.12, the break down would be:
The tricky part in this calculation is that we need to get a total for each order and combine it back with the transaction level detail in order to get the percentages. In Excel, you could try to use some version of a subtotal to try to calculate the values. First Approach - MergingIf you are familiar with pandas, your first inclination is going to be trying to group the data into a new dataframe and combine it in a multi-step process. Here’s what that approach would look like. Import all the modules we need and read in our data: import pandas as pd df = pd.read_excel("sales_transactions.xlsx") Now that the data is in a dataframe, determining the total by order is simple with the
help of the standard df.groupby('order')["ext price"].sum() order 10001 576.12 10005 8185.49 10006 3724.49 Name: ext price, dtype: float64 Here is a simple image showing what is happening with the standard 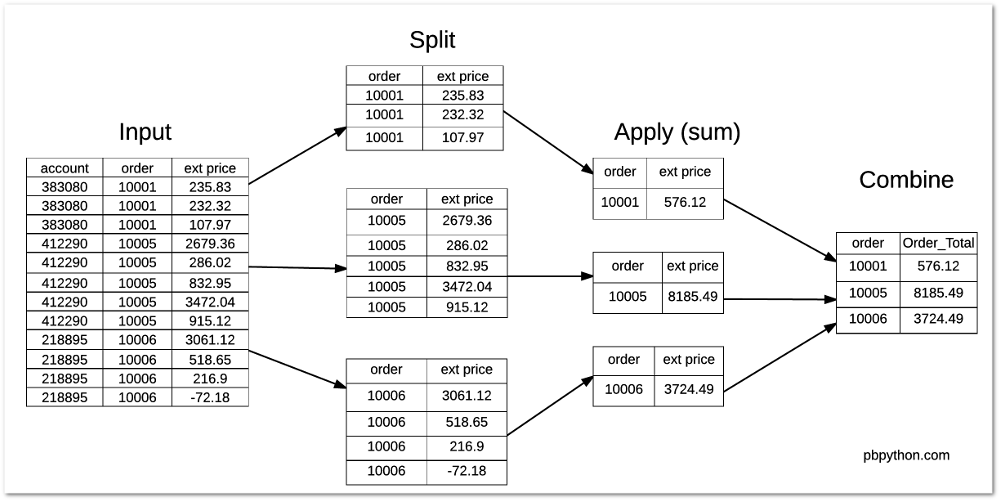
The tricky part is figuring out how to combine this data back with the original dataframe. The first instinct is to create a new dataframe with the totals by order and merge it back with the original. We could do something like this: order_total = df.groupby('order')["ext price"].sum().rename("Order_Total").reset_index() df_1 = df.merge(order_total) df_1["Percent_of_Order"] = df_1["ext price"] / df_1["Order_Total"]
This certainly works but there are several steps needed to get the data combined in the manner we need. Second Approach - Using TransformUsing the original data, let’s try using df.groupby('order')["ext price"].transform('sum') 0 576.12 1 576.12 2 576.12 3 8185.49 4 8185.49 5 8185.49 6 8185.49 7 8185.49 8 3724.49 9 3724.49 10 3724.49 11 3724.49 dtype: float64 You will notice how this returns a different size data set from our normal The final step is pretty simple: df["Order_Total"] = df.groupby('order')["ext price"].transform('sum') df["Percent_of_Order"] = df["ext price"] / df["Order_Total"]
As an added bonus, you could combine into one statement if you did not want to show the individual order totals: df["Percent_of_Order"] = df["ext price"] / df.groupby('order')["ext price"].transform('sum') Here is a diagram to show what is happening:
After taking the time to understand ConclusionI am continually amazed at the power of pandas to make complex numerical manipulations
very efficient. Despite working with pandas for a while, I never took the time to figure
out how to use
Tags
pandas
Comments | ||||||||||||||||||||||||||||||||||||||||||||||||||||||||||||||||||||||||||||||||||||||||||||||||||||||||||||||||||||||||||||||||||||||||||||||||||||||||||||||||||||||||||||||||||||||||||||||||||||||||||||||||||||||||||||||||||||||||||||||||||||||||||||||||||||||||||||||||||||||||||||||||||||||||||||||||||||||||||||||||||||||||||||||||||||||||||||||||||||||||||||||||||||||||||||||||||||||
| You are visitor 01402503 — GeezerVison does not store the pages you look up. Best viewed with Netscape Navigator 4.7 or Internet Explorer 6 at 800×600. No cookies required. |