GeezerVisonThe World Wide Web, restored to 800 pixels of glory. | ||||||||||||||||||||||||||||||||||||||||||||||||||||||||||||||||||||||||||||||||||||||||||||||||||||||||||||||||||||||||||||||||||||||||||||||||||||||||||||||||
| Home|About|Gaming cabinet|Archives|How it works|Starter sites | ||||||||||||||||||||||||||||||||||||||||||||||||||||||||||||||||||||||||||||||||||||||||||||||||||||||||||||||||||||||||||||||||||||||||||||||||||||||||||||||||
GeezerVison is showing pbpython.com — Case Study: Processing Historical Weather Pattern Data - Practical Business Python 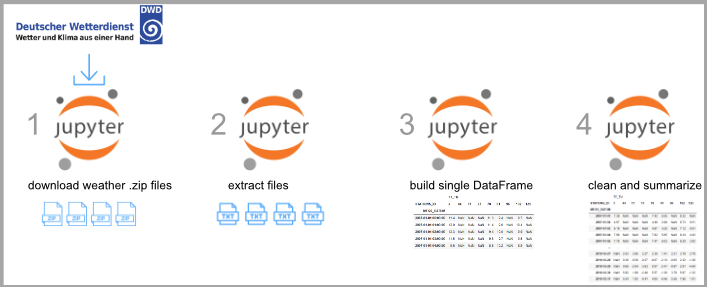
IntroductionThe main purpose of this blog is to show people how to use Python to solve real world problems. Over the years, I have been fortunate enough to hear from readers about how they have used tips and tricks from this site to solve their own problems. In this post, I am extremely delighted to present a real world case study. I hope it will give you some ideas about how you can apply these concepts to your own problems. This example comes from Michael Biermann from Germany. He had the challenging task of trying to gather detailed historical weather data in order to do analysis on the relationship between air temperature and power consumption. This article will show how he used a pipeline of Python programs to automate the process of collecting, cleaning and processing gigabytes of weather data in order to perform his analysis. Problem BackgroundI will turn it over to Michael to give the background for this problem.
Here is a visual to help understand the process Michael created:
If you are interested in following along, all of the code examples are available here. Downloading the DataThe first notebook in the pipeline is The data is delivered in hourly frequencies in a .zip file for each of the available weather stations. To use the data, we need everything in a single .csv file with all stations side-by-side. Also, we need the daily average. To reduce computing time, we also crop all data earlier than 2007. For the purposes of this article, I have limited the download to only 10 files but the full data set is over 600 files. import requests import re from bs4 import BeautifulSoup from pathlib import Path # Set base values download_folder = Path.cwd() / 'download' base_url = 'https://opendata.dwd.de/climate_environment/CDC/observations_germany/climate/hourly/air_temperature/historical/' # Initiate Session and get the Index-Page with requests.Session() as s: resp = s.get(base_url) # Parse the Index-Page for all relevant <a href> soup = BeautifulSoup(resp.content) links = soup.findAll("a", href=re.compile("stundenwerte_TU_.*_hist.zip")) # For testing, only download 10 files file_max = 10 dl_count = 0 #Download the .zip files to the download_folder for link in links: zip_response = requests.get(base_url + link['href'], stream=True) # Limit the downloads while testing dl_count += 1 if dl_count > file_max: break with open(Path(download_folder) / link['href'], 'wb') as file: for chunk in zip_response.iter_content(chunk_size=128): file.write(chunk) print('Done') This portion of code will parse the download page and find all of the zip files with the name
Extracting the DataAfter the first step is completed, the download directory contains multiple zip files.
The second notebook in the process is The program will then extract each file and move to the from pathlib import Path import glob import re from zipfile import ZipFile # Folder definitions download_folder = Path.cwd() / 'download' import_folder = Path.cwd() / 'import' # Find all .zip files and generate a list unzip_files = glob.glob('download/stundenwerte_TU_*_hist.zip') # Set the name pattern of the file we need regex_name = re.compile('produkt.*') # Open all files, look for files that match ne regex pattern, extract to 'import' for file in unzip_files: with ZipFile(file, 'r') as zipObj: list_of_filenames = zipObj.namelist() extract_filename = list(filter(regex_name.match, list_of_filenames))[0] zipObj.extract(extract_filename, import_folder) display('Done') After running this script, the STATIONS_ID;MESS_DATUM;QN_9;TT_TU;RF_TU;eor 3;1950040101; 5; 5.7; 83.0;eor 3;1950040102; 5; 5.6; 83.0;eor 3;1950040103; 5; 5.5; 83.0;eor 3;1950040104; 5; 5.5; 83.0;eor 3;1950040105; 5; 5.8; 85.0;eor Building the DataFrameNow that we have isolated the data we need, we must format it for further analysis. There are three steps in this notebook Process Individual FilesThe files are imported into a single DataFrame, stripped of unnecessary columns and filtered by date.
Then we set a Process the concatenated main_dfThen we display some info of the Unstack and exportFor the final step, we unstack the Now let’s look at the code: import numpy as np import pandas as pd from IPython.display import clear_output from pathlib import Path import glob import_files = glob.glob('import/*') out_file = Path.cwd() / "export_uncleaned" / "to_clean" obsolete_columns = [ 'QN_9', 'RF_TU', 'eor' ] main_df = pd.DataFrame() i = 1 for file in import_files: # Read in the next file df = pd.read_csv(file, delimiter=";") # Prepare the df before merging (Drop obsolete, convert to datetime, filter to date, set index) df.drop(columns=obsolete_columns, inplace=True) df["MESS_DATUM"] = pd.to_datetime(df["MESS_DATUM"], format="%Y%m%d%H") df = df[df['MESS_DATUM']>= "2007-01-01"] df.set_index(['MESS_DATUM', 'STATIONS_ID'], inplace=True) # Merge to the main_df main_df = pd.concat([main_df, df]) # Display some status messages clear_output(wait=True) display('Finished file: {}'.format(file), 'This is file {}'.format(i)) display('Shape of the main_df is: {}'.format(main_df.shape)) i+=1 # Check if all types are correct display(main_df['TT_TU'].apply(lambda x: type(x).__name__).value_counts()) # Make sure that to files or observations a duplicates, eg. scan the index for duplicate entries. # The ~ is a bitwise operation, meaning it flips all bits. main_df = main_df[~main_df.index.duplicated(keep='last')] # Unstack the main_df main_df = main_df.unstack('STATIONS_ID') display('Shape of the main_df is: {}'.format(main_df.shape)) # Save main_df to a .csv file and a pickle to continue working in the next step main_df.to_pickle(Path(out_file).with_suffix('.pkl')) main_df.to_csv(Path(out_file).with_suffix('.csv'), sep=";") display(main_df.head()) display(main_df.describe()) As this program runs, here is some of the progress output: 'Finished file: import/produkt_tu_stunde_20041101_20191231_00078.txt' 'This is file 10' 'Shape of the main_df is: (771356, 1)' float 771356 Name: TT_TU, dtype: int64 'Shape of the main_df is: (113952, 9)' Here is what the final DataFrame looks like:
At the end of this step, we have the file in a condensed format we can use for analysis. Final ProcessingThe data contains some errors, which need to be cleaned. You can see, by looking at the
output of Once these values are corrected, we need to resample to daily measurements. Pandas import numpy as np import pandas as pd from pathlib import Path # Import and export paths pkl_file = Path.cwd() / "export_uncleaned" / "to_clean.pkl" cleaned_file = Path.cwd() / "export_cleaned" / "cleaned.csv" # Read in the pickle file from the last cell cleaning_df = pd.read_pickle(pkl_file) # Replace all values with "-999", which indicate missing data cleaning_df.replace(to_replace=-999, value=np.nan, inplace=True) # Resample to daily frequency cleaning_df = cleaning_df.resample('D').mean().round(decimals=2) # Save as .csv cleaning_df.to_csv(cleaned_file, sep=";", decimal=",") # Show some results for verification display(cleaning_df.loc['2011-12-31':'2012-01-04']) display(cleaning_df.describe()) display(cleaning_df) Here is the final DataFrame with daily average values for the stations:
SummaryThere are several aspects of this case study that I really like.
Finally, I love this quote from Michael: There is hardly anything as satisfying as letting the computer do the hard work for the next 20 min, while grabbing a cup of coffee. I agree 100%. Thank you Michael for taking the time to share such a great example! I hope it gives you some ideas to apply to your own projects.
Tags
pandas
Comments | ||||||||||||||||||||||||||||||||||||||||||||||||||||||||||||||||||||||||||||||||||||||||||||||||||||||||||||||||||||||||||||||||||||||||||||||||||||||||||||||||
| You are visitor 01402503 — GeezerVison does not store the pages you look up. Best viewed with Netscape Navigator 4.7 or Internet Explorer 6 at 800×600. No cookies required. | ||||||||||||||||||||||||||||||||||||||||||||||||||||||||||||||||||||||||||||||||||||||||||||||||||||||||||||||||||||||||||||||||||||||||||||||||||||||||||||||||