GeezerVisonThe World Wide Web, restored to 800 pixels of glory. |
| Home|About|Gaming cabinet|Archives|How it works|Starter sites |
GeezerVison is showing pythonot.github.io — Geometry of OT distances — POT Python Optimal Transport 0.9.7 documentation Note Go to the end to download the full example code. Geometry of OT distancesShows how to compute multiple Wasserstein and Sinkhorn with two different ground metrics and plot their values for different distributions. # Author: Remi Flamary <[email protected]> # # License: MIT License # sphinx_gallery_thumbnail_number = 2 import numpy as np import matplotlib.pylab as pl import ot from ot.datasets import make_1D_gauss as gauss Generate datan = 100 # nb bins n_target = 20 # nb target distributions # bin positions x = np.arange(n, dtype=np.float64) lst_m = np.linspace(20, 90, n_target) # Gaussian distributions a = gauss(n, m=20, s=5) # m= mean, s= std B = np.zeros((n, n_target)) for i, m in enumerate(lst_m): B[:, i] = gauss(n, m=m, s=5) # loss matrix and normalization M = ot.dist(x.reshape((n, 1)), x.reshape((n, 1)), "euclidean") M /= M.max() * 0.1 M2 = ot.dist(x.reshape((n, 1)), x.reshape((n, 1)), "sqeuclidean") M2 /= M2.max() * 0.1 Plot datapl.figure(1) pl.subplot(2, 1, 1) pl.plot(x, a, "r", label="Source distribution") pl.title("Source distribution") pl.subplot(2, 1, 2) for i in range(n_target): pl.plot(x, B[:, i], "b", alpha=i / n_target) pl.plot(x, B[:, -1], "b", label="Target distributions") pl.title("Target distributions") pl.tight_layout() 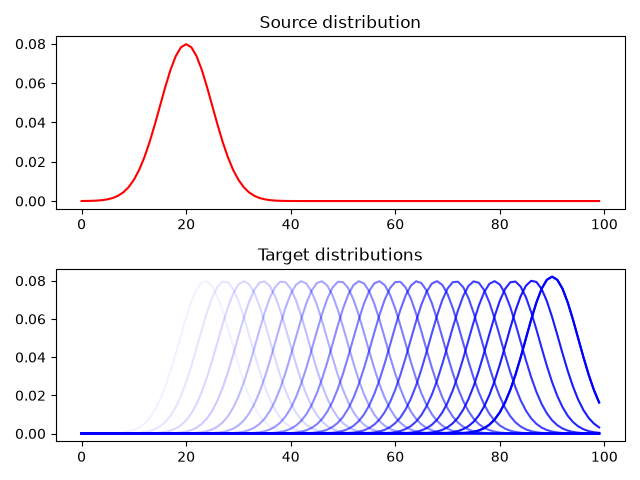 Compute EMD for the different lossesd_emd = ot.emd2(a, B, M) # direct computation of OT loss d_emd2 = ot.emd2(a, B, M2) # direct computation of OT loss with metric M2 d_tv = [np.sum(abs(a - B[:, i])) for i in range(n_target)] pl.figure(2) pl.subplot(2, 1, 1) pl.plot(x, a, "r", label="Source distribution") pl.title("Distributions") for i in range(n_target): pl.plot(x, B[:, i], "b", alpha=i / n_target) pl.plot(x, B[:, -1], "b", label="Target distributions") pl.ylim((-0.01, 0.13)) pl.xticks(()) pl.legend() pl.subplot(2, 1, 2) pl.plot(d_emd, label="Euclidean OT") pl.plot(d_emd2, label="Squared Euclidean OT") pl.plot(d_tv, label="Total Variation (TV)") # pl.xlim((-7,23)) pl.xlabel("Displacement") pl.title("Divergences") pl.legend() 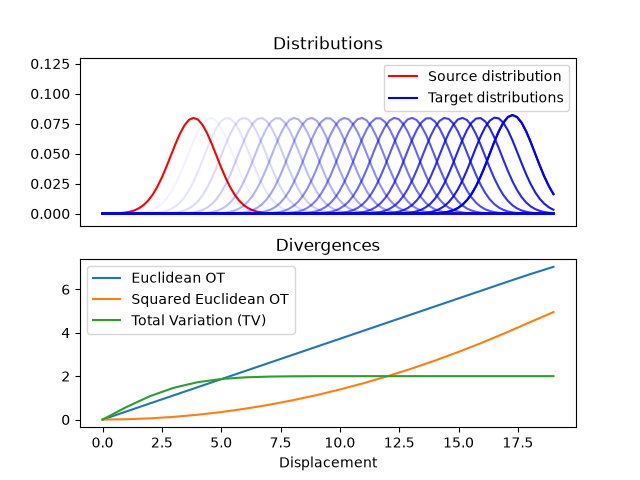 <matplotlib.legend.Legend object at 0x7e9793e16930> Compute Sinkhorn for the different lossesreg = 1e-1 d_sinkhorn = ot.sinkhorn2(a, B, M, reg) d_sinkhorn2 = ot.sinkhorn2(a, B, M2, reg) pl.figure(3) pl.clf() pl.subplot(2, 1, 1) pl.plot(x, a, "r", label="Source distribution") pl.title("Distributions") for i in range(n_target): pl.plot(x, B[:, i], "b", alpha=i / n_target) pl.plot(x, B[:, -1], "b", label="Target distributions") pl.ylim((-0.01, 0.13)) pl.xticks(()) pl.legend() pl.subplot(2, 1, 2) pl.plot(d_emd, label="Euclidean OT") pl.plot(d_emd2, label="Squared Euclidean OT") pl.plot(d_sinkhorn, "+", label="Euclidean Sinkhorn") pl.plot(d_sinkhorn2, "+", label="Squared Euclidean Sinkhorn") pl.plot(d_tv, label="Total Variation (TV)") # pl.xlim((-7,23)) pl.xlabel("Displacement") pl.title("Divergences") pl.legend() pl.show() 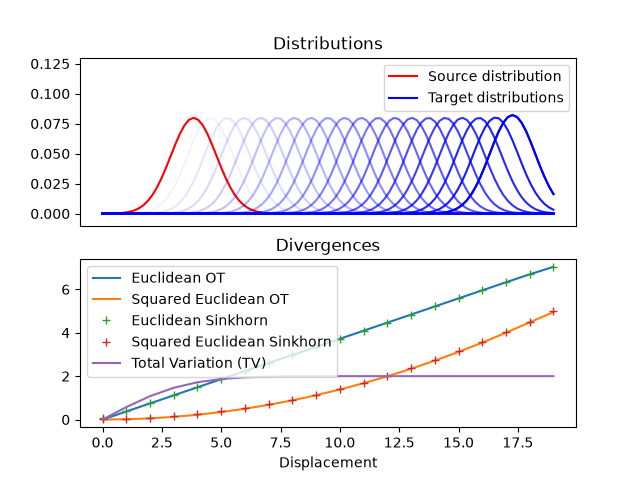 Total running time of the script: (0 minutes 0.638 seconds)
Python Optimal Transport 0.9.7
Versions: Release Development Code |
| You are visitor 01402503 — GeezerVison does not store the pages you look up. Best viewed with Netscape Navigator 4.7 or Internet Explorer 6 at 800×600. No cookies required. |