GeezerVisonThe World Wide Web, restored to 800 pixels of glory. |
| Home|About|Gaming cabinet|Archives|How it works|Starter sites |
GeezerVison is showing pythonot.github.io — Sparse Optimal Transport — POT Python Optimal Transport 0.9.7 documentation Note Go to the end to download the full example code. Sparse Optimal TransportIn many real-world optimal transport (OT) problems, the transport plan is naturally sparse: only a small fraction of all possible source-target pairs actually exchange mass. Using sparse OT solvers can provide significant computational speedups and memory savings compared to dense solvers. This example demonstrates how to use sparse cost matrices with POT’s EMD solver, comparing sparse and dense formulations on both a minimal example and a larger concentric circles dataset. # Author: Nathan Neike # # License: MIT License # sphinx_gallery_thumbnail_number = 2 import numpy as np import matplotlib.pyplot as plt from scipy.sparse import coo_array import ot Example: concentric circlesn_clusters = 8 points_per_cluster = 25 n = n_clusters * points_per_cluster k_neighbors = 8 rng = np.random.default_rng(0) r_source = 1.0 r_target = 2.0 noise_scale = 0.06 theta = np.linspace(0.0, 2.0 * np.pi, n, endpoint=False) cluster_labels = np.repeat(np.arange(n_clusters), points_per_cluster) X_large = np.column_stack( [r_source * np.cos(theta), r_source * np.sin(theta)] ) + rng.normal(scale=noise_scale, size=(n, 2)) Y_large = np.column_stack( [r_target * np.cos(theta), r_target * np.sin(theta)] ) + rng.normal(scale=noise_scale, size=(n, 2)) a_large = np.zeros(n) b_large = np.zeros(n) for k in range(n_clusters): idx = np.where(cluster_labels == k)[0] a_large[idx] = 1.0 / n_clusters / points_per_cluster b_large[idx] = 1.0 / n_clusters / points_per_cluster M_full = ot.dist(X_large, Y_large, metric="euclidean") # Build sparse cost matrix: intra-cluster k-nearest neighbors angles_X = np.arctan2(X_large[:, 1], X_large[:, 0]) angles_Y = np.arctan2(Y_large[:, 1], Y_large[:, 0]) rows = [] cols = [] vals = [] for k in range(n_clusters): src_idx = np.where(cluster_labels == k)[0] tgt_idx = np.where(cluster_labels == k)[0] for i in src_idx: diff = np.angle(np.exp(1j * (angles_Y[tgt_idx] - angles_X[i]))) idx = np.argsort(np.abs(diff))[:k_neighbors] for j_local in idx: j = tgt_idx[j_local] rows.append(i) cols.append(j) vals.append(M_full[i, j]) M_sparse_large = coo_array((vals, (rows, cols)), shape=(n, n)) allowed_sparse = set(zip(rows, cols)) Visualize edge structuresplt.figure(figsize=(16, 6)) plt.subplot(1, 2, 1) for i in range(n): for j in range(n): plt.plot( [X_large[i, 0], Y_large[j, 0]], [X_large[i, 1], Y_large[j, 1]], color="blue", alpha=0.2, linewidth=0.05, ) plt.scatter(X_large[:, 0], X_large[:, 1], c="r", marker="o", s=20) plt.scatter(Y_large[:, 0], Y_large[:, 1], c="b", marker="x", s=20) plt.axis("equal") plt.title("Dense OT: All Possible Edges") plt.subplot(1, 2, 2) for i, j in allowed_sparse: plt.plot( [X_large[i, 0], Y_large[j, 0]], [X_large[i, 1], Y_large[j, 1]], color="blue", alpha=1, linewidth=0.05, ) plt.scatter(X_large[:, 0], X_large[:, 1], c="r", marker="o", s=20) plt.scatter(Y_large[:, 0], Y_large[:, 1], c="b", marker="x", s=20) plt.axis("equal") plt.title("Sparse OT: Intra-Cluster k-NN Edges") plt.tight_layout() plt.show() 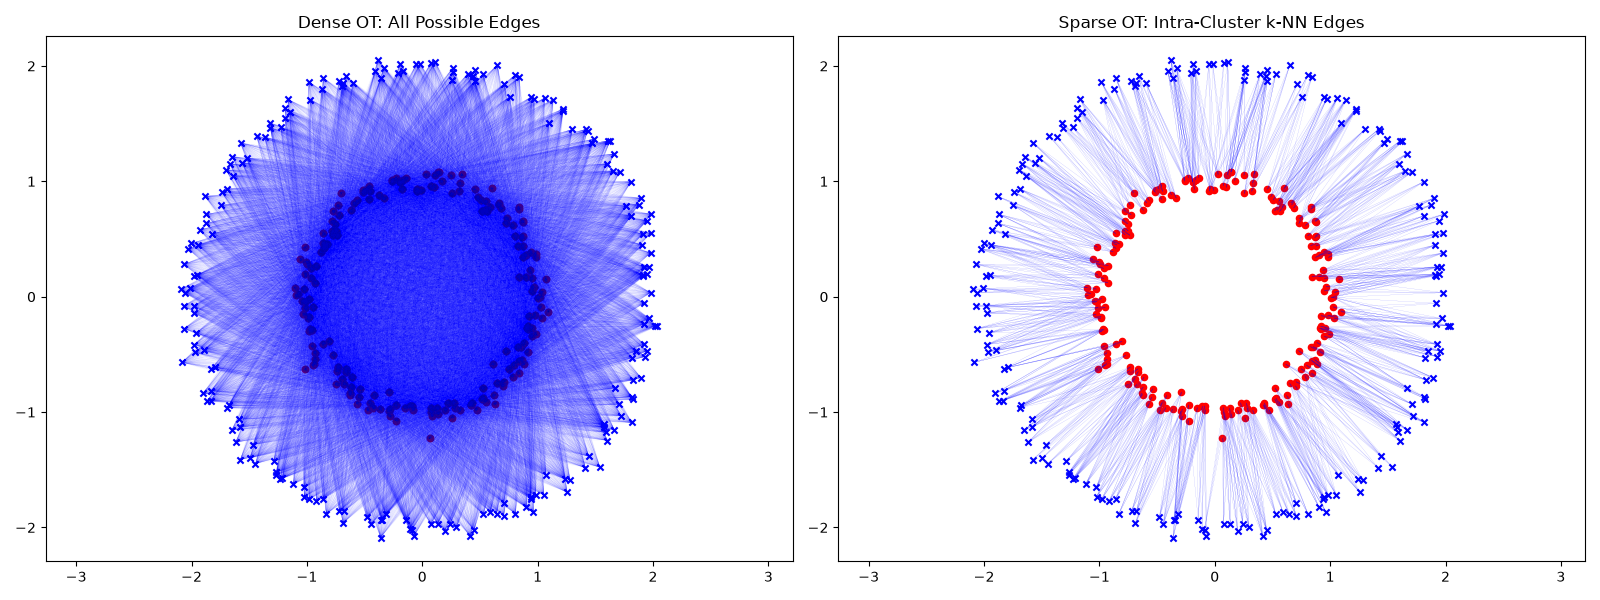 Solve and visualize transport plansG_dense = ot.emd(a_large, b_large, M_full) cost_dense = np.sum(G_dense * M_full) print(f"Dense OT cost: {cost_dense:.6f}") G_sparse, log_sparse = ot.emd(a_large, b_large, M_sparse_large, log=True) cost_sparse = log_sparse["cost"] print(f"Sparse OT cost: {cost_sparse:.6f}") plt.figure(figsize=(16, 6)) plt.subplot(1, 2, 1) ot.plot.plot2D_samples_mat( X_large, Y_large, G_dense, thr=1e-10, c=[0.5, 0.5, 1], alpha=0.5 ) plt.scatter(X_large[:, 0], X_large[:, 1], c="r", marker="o", s=20, zorder=3) plt.scatter(Y_large[:, 0], Y_large[:, 1], c="b", marker="x", s=20, zorder=3) plt.axis("equal") plt.title("Dense OT: Optimal Transport Plan") plt.subplot(1, 2, 2) ot.plot.plot2D_samples_mat( X_large, Y_large, G_sparse, thr=1e-10, c=[0.5, 0.5, 1], alpha=0.5 ) plt.scatter(X_large[:, 0], X_large[:, 1], c="r", marker="o", s=20, zorder=3) plt.scatter(Y_large[:, 0], Y_large[:, 1], c="b", marker="x", s=20, zorder=3) plt.axis("equal") plt.title("Sparse OT: Optimal Transport Plan") plt.tight_layout() plt.show() 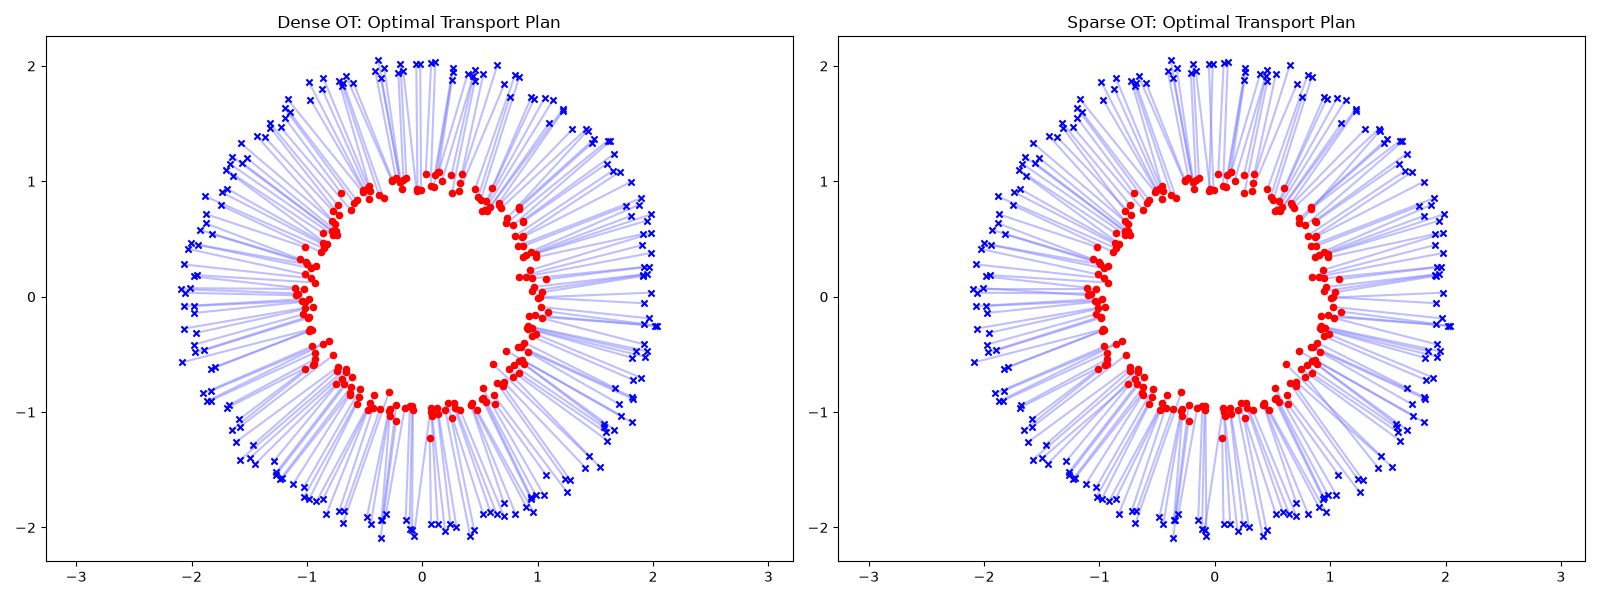 Dense OT cost: 0.992179 Sparse OT cost: 0.992290 Total running time of the script: (0 minutes 29.065 seconds)
Python Optimal Transport 0.9.7
Versions: Release Development Code |
| You are visitor 01402520 — GeezerVison does not store the pages you look up. Best viewed with Netscape Navigator 4.7 or Internet Explorer 6 at 800×600. No cookies required. |