GeezerVison is showing pythonot.github.io — ot.plot — POT Python Optimal Transport 0.9.7 documentation
ot.plot
Functions for plotting OT matrices
Warning
Note that by default the module is not import in ot. In order to
use it you need to explicitly import ot.plot
Functions
-
ot.plot.plot1D_mat(a, b, M, title='', plot_style='yx', a_label='', b_label='', color_source='b', color_target='r', coupling_cmap='gray_r')[source]
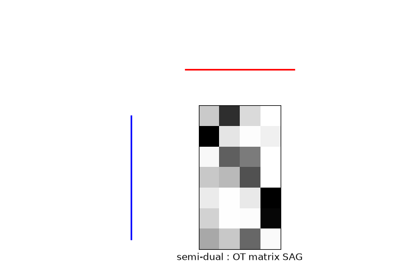
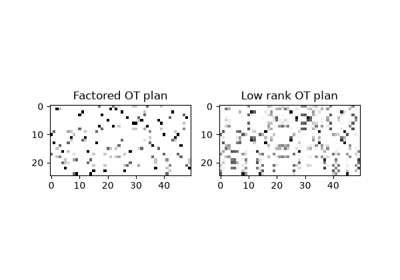
Plot matrix \(\mathbf{M}\) with the source and target 1D distributions.
Creates a subplot with the source distribution \(\mathbf{a}\) and target
distribution \(\mathbf{b}\).
In ‘yx’ mode (default), the source is on the left and
the target on the top, and in ‘xy’ mode, source on the bottom (upside
down) and the target on the left.
The matrix \(\mathbf{M}\) is shown in between.
- Parameters:
a (ndarray, shape (na,)) – Source distribution b (ndarray, shape (nb,)) – Target distribution M (ndarray, shape (na, nb)) – Matrix to plot title (str, optional) – Title of the plot plot_style (str, optional) – Style of the plot, ‘yx’ or ‘xy’. ‘yx’ places the source on the left and
the target on the top, ‘xy’ places the source on the bottom (upside
down) and the target on the left. a_label (str, optional) – Label for source distribution b_label (str, optional) – Label for target distribution color_source (str, optional) – Color of the source distribution color_target (str, optional) – Color of the target distribution coupling_cmap (str, optional) – Colormap for the coupling matrix
- Returns:
ax1 (source plot ax) ax2 (target plot ax) ax3 (coupling plot ax)
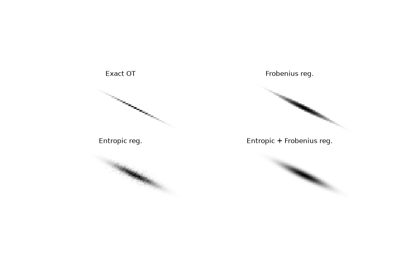
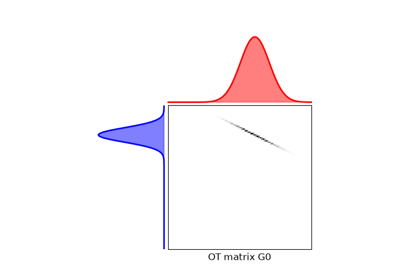
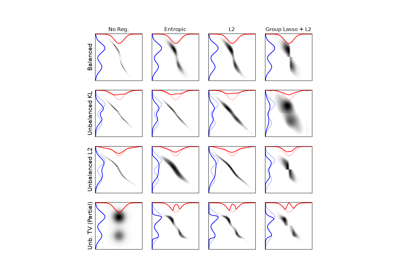
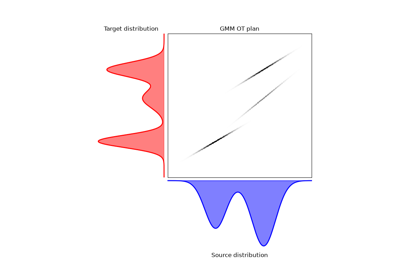
Examples using ot.plot.plot1D_mat
-
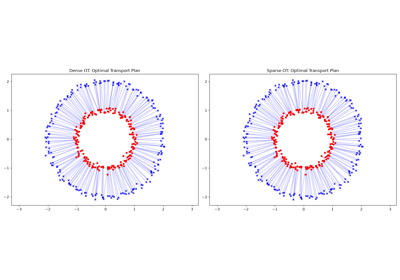
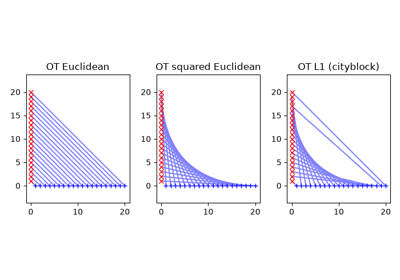
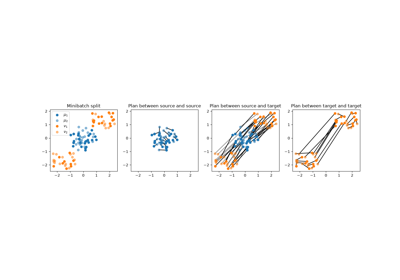
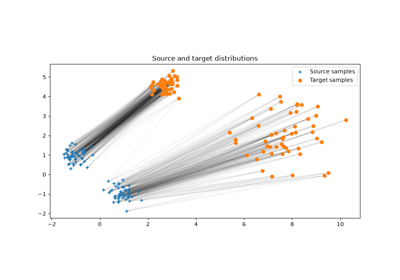
ot.plot.plot2D_samples_mat(xs, xt, G, thr=1e-08, **kwargs)[source]
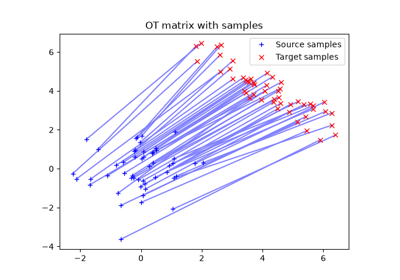
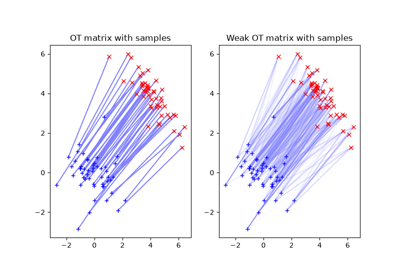
Plot matrix \(\mathbf{G}\) in 2D with lines using alpha values
Plot lines between source and target 2D samples with a color
proportional to the value of the matrix \(\mathbf{G}\) between samples.
Supports both dense and sparse matrices. For sparse matrices, automatically
detects the format and efficiently iterates only over non-zero entries.
- Parameters:
xs (ndarray, shape (ns,2)) – Source samples positions xt (ndarray, shape (nt,2)) – Target samples positions G (ndarray or sparse matrix, shape (ns,nt)) – OT matrix (dense array, scipy.sparse matrix, or backend array) thr (float, optional) – threshold above which the line is drawn **kwargs (dict) – parameters given to the plot functions (default color is black if
nothing given)
Examples using ot.plot.plot2D_samples_mat
-
ot.plot.rescale_for_imshow_plot(x, y, n, m=None, a_y=None, b_y=None)[source]
Gives arrays xr, yr that can be plotted over an (n, m)
imshow plot (in ‘xy’ coordinates). If a_y or b_y is provided,
y is sliced over its indices such that y stays in [ay, by].
- Parameters:
x (ndarray, shape (nx,)) y (ndarray, shape (nx,)) n (int) – x-axis size of the imshow plot on which to plot (x, y) m (int, optional) – y-axis size of the imshow plot, defaults to n a_y (float, optional) – Lower bound for y b_y (float, optional) – Upper bound for y
- Returns:
xr (ndarray, shape (nx,)) – Rescaled x values (due to slicing, may have less elements than x) yr (ndarray, shape (nx,)) – Rescaled y values (due to slicing, may have less elements than y)
Examples using ot.plot.rescale_for_imshow_plot
-
ot.plot.plot1D_mat(a, b, M, title='', plot_style='yx', a_label='', b_label='', color_source='b', color_target='r', coupling_cmap='gray_r')[source]
Plot matrix \(\mathbf{M}\) with the source and target 1D distributions.
Creates a subplot with the source distribution \(\mathbf{a}\) and target
distribution \(\mathbf{b}\).
In ‘yx’ mode (default), the source is on the left and
the target on the top, and in ‘xy’ mode, source on the bottom (upside
down) and the target on the left.
The matrix \(\mathbf{M}\) is shown in between.
- Parameters:
a (ndarray, shape (na,)) – Source distribution b (ndarray, shape (nb,)) – Target distribution M (ndarray, shape (na, nb)) – Matrix to plot title (str, optional) – Title of the plot plot_style (str, optional) – Style of the plot, ‘yx’ or ‘xy’. ‘yx’ places the source on the left and
the target on the top, ‘xy’ places the source on the bottom (upside
down) and the target on the left. a_label (str, optional) – Label for source distribution b_label (str, optional) – Label for target distribution color_source (str, optional) – Color of the source distribution color_target (str, optional) – Color of the target distribution coupling_cmap (str, optional) – Colormap for the coupling matrix
- Returns:
ax1 (source plot ax) ax2 (target plot ax) ax3 (coupling plot ax)
-
ot.plot.plot2D_samples_mat(xs, xt, G, thr=1e-08, **kwargs)[source]
Plot matrix \(\mathbf{G}\) in 2D with lines using alpha values
Plot lines between source and target 2D samples with a color
proportional to the value of the matrix \(\mathbf{G}\) between samples.
Supports both dense and sparse matrices. For sparse matrices, automatically
detects the format and efficiently iterates only over non-zero entries.
- Parameters:
xs (ndarray, shape (ns,2)) – Source samples positions xt (ndarray, shape (nt,2)) – Target samples positions G (ndarray or sparse matrix, shape (ns,nt)) – OT matrix (dense array, scipy.sparse matrix, or backend array) thr (float, optional) – threshold above which the line is drawn **kwargs (dict) – parameters given to the plot functions (default color is black if
nothing given)
-
ot.plot.rescale_for_imshow_plot(x, y, n, m=None, a_y=None, b_y=None)[source]
Gives arrays xr, yr that can be plotted over an (n, m)
imshow plot (in ‘xy’ coordinates). If a_y or b_y is provided,
y is sliced over its indices such that y stays in [ay, by].
- Parameters:
x (ndarray, shape (nx,)) y (ndarray, shape (nx,)) n (int) – x-axis size of the imshow plot on which to plot (x, y) m (int, optional) – y-axis size of the imshow plot, defaults to n a_y (float, optional) – Lower bound for y b_y (float, optional) – Upper bound for y
- Returns:
xr (ndarray, shape (nx,)) – Rescaled x values (due to slicing, may have less elements than x) yr (ndarray, shape (nx,)) – Rescaled y values (due to slicing, may have less elements than y)
|