GeezerVisonThe World Wide Web, restored to 800 pixels of glory. |
| Home|About|Gaming cabinet|Archives|How it works|Starter sites |
GeezerVison is showing r-spatial.org — Spatial Data Science PrefaceData science is concerned with finding answers to questions on the basis of available data, and communicating that effort. Besides showing the results, this communication involves sharing the data used, but also exposing the path that led to the answers in a comprehensive and reproducible way. It also acknowledges the fact that available data may not be sufficient to answer questions, and that any answers are conditional on the data collection or sampling protocols employed.
This book introduces and explains the concepts underlying spatial data: points, lines, polygons, rasters, coverages, geometry attributes, data cubes, reference systems, as well as higher-level concepts including how attributes relate to geometries and how this affects analysis. The relationship of attributes to geometries is known as support, and changing support also changes the characteristics of attributes. Some data generation processes are continuous in space, and may be observed everywhere. Others are discrete, observed in tesselated containers. In modern spatial data analysis, tesellated methods are often used for all data, extending across the legacy partition into point process, geostatistical and lattice models. It is support (and the understanding of support) that underlies the importance of spatial representation. The book aims at data scientists who want to get a grip on using spatial data in their analysis. To exemplify how to do things, it uses R. In future editions we hope to extend this with examples using Python (see, e.g., Bivand 2022a) and Julia. It is often thought that spatial data boils down to having observations’ longitude and latitude in a dataset, and treating these just like any other variable. This carries the risk of missed opportunities and meaningless analyses. For instance,
We introduce the concepts behind spatial data, coordinate reference systems, spatial analysis, and introduce a number of packages, including sf (Pebesma 2018, 2022a), stars (Pebesma 2022b), s2 (Dunnington et al. 2023) and lwgeom (Pebesma 2023), as well as a number of spatial tidyverse (Wickham et al. 2019; Wickham 2022) extensions, and a number of spatial analysis and visualisation packages that can be used with these packages, including gstat (Pebesma 2004; Pebesma and Graeler 2022), spdep (Bivand 2022b), spatialreg (Bivand and Piras 2022), spatstat (Baddeley et al. 2015, 2022), tmap (Tennekes 2018, 2022) and mapview (Appelhans et al. 2022). Like data science, spatial data science seems to be a field that arises bottom-up in and from many existing scientific disciplines and industrial activities concerned with application of spatial data, rather than being a sub-discipline of an existing scientific discipline. Although there are various activities trying to scope it through focused conferences, symposia, chairs and study programs, we believe that the versatility of spatial data applications and questions will render such activity hard. Giving this book the title “spatial data science” is not another attempt to define the bounds of this field but rather an attempt to contribute to it from our 3-4 decades of experience working with researchers from various fields willing to publicly share research questions, data, and attempts to solve these questions with software. As a consequence, the selection of topics found in this book has a certain bias towards our own areas of research interest and experience. Platforms that have helped create an open research community include the ai-geostats and r-sig-geo mailing lists, sourceforge, r-forge, GitHub, and the OpenGeoHub summer schools organized yearly since 2007. The current possibility and willingness to cross data science language barriers opens a new and very exciting perspective. Our motivation to contribute to this field is a belief that open science leads to better science, and that better science might contribute to a more sustainable world. PythonThe edition of this book that has as subtitle with applications in R and Python contains Python code for selected code sections, and shows code and output in a tabset for the html-rendered version of the book. The Python code used is work in progress, and improvements and additions to it are highly appreciated. Printed version of this book
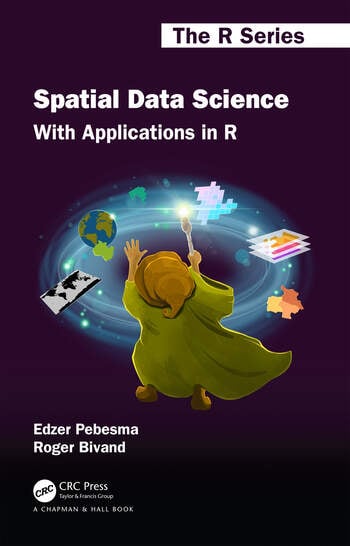
The printed version of this book (1st edition) is available from the Routeledge/CRC or Taylor and Francis websites. Cover art was created by Allison Horst. Citing this bookThe full reference is: Pebesma, E.; Bivand, R. (2023). Spatial Data Science: With Applications in R (1st ed.). 314 pages. Chapman and Hall/CRC, Boca Raton. https://doi.org/10.1201/9780429459016 BibTeX: AcknowledgementsWe are grateful to the entire r-spatial community, especially those who
We are in particular grateful to Dewey Dunnington for implementing the s2 package, and for active contributions from Sahil Bhandari, Jonathan Bahlmann for preparing the figures in 6 Data Cubes, Claus Wilke, Jakub Nowosad, the “Spatial Data Science with R” classes of 2021 and 2022, and to those who actively contributed with GitHub issues, pull requests, or discussions:
Appelhans, Tim, Florian Detsch, Christoph Reudenbach, and Stefan Woellauer. 2022. Mapview: Interactive Viewing of Spatial Data in r. https://github.com/r-spatial/mapview.
Baddeley, Adrian, Ege Rubak, and Rolf Turner. 2015. Spatial Point Patterns: Methodology and Applications with R. Chapman & Hall/CRC.
Baddeley, Adrian, Rolf Turner, and Ege Rubak. 2022. Spatstat: Spatial Point Pattern Analysis, Model-Fitting, Simulation, Tests. http://spatstat.org/.
Bivand, Roger. 2022a. “R Packages for Analyzing Spatial Data: A Comparative Case Study with Areal Data.” Geographical Analysis 54 (3): 488–518. https://doi.org/10.1111/gean.12319.
Bivand, Roger. 2022b. Spdep: Spatial Dependence: Weighting Schemes, Statistics.
Bivand, Roger, and Gianfranco Piras. 2022. Spatialreg: Spatial Regression Analysis. https://CRAN.R-project.org/package=spatialreg.
Dunnington, Dewey, Edzer Pebesma, and Ege Rubak. 2023. S2: Spherical Geometry Operators Using the S2 Geometry Library. https://CRAN.R-project.org/package=s2.
Pebesma, Edzer. 2004. “Multivariable Geostatistics in S: The Gstat Package.” Computers & Geosciences 30: 683–91.
Pebesma, Edzer. 2018. “Simple Features for R: Standardized Support for Spatial Vector Data.” The R Journal 10 (1): 439–46. https://doi.org/10.32614/RJ-2018-009.
Pebesma, Edzer. 2022a. Sf: Simple Features for r. https://CRAN.R-project.org/package=sf.
Pebesma, Edzer. 2022b. Stars: Spatiotemporal Arrays, Raster and Vector Data Cubes. https://CRAN.R-project.org/package=stars.
Pebesma, Edzer. 2023. Lwgeom: Bindings to Selected Liblwgeom Functions for Simple Features. https://github.com/r-spatial/lwgeom/.
Pebesma, Edzer, and Benedikt Graeler. 2022. Gstat: Spatial and Spatio-Temporal Geostatistical Modelling, Prediction and Simulation. https://github.com/r-spatial/gstat/.
Tennekes, Martijn. 2018. “tmap: Thematic Maps in R.” Journal of Statistical Software 84 (6): 1–39. https://doi.org/10.18637/jss.v084.i06.
Tennekes, Martijn. 2022. Tmap: Thematic Maps. https://github.com/r-tmap/tmap.
Wickham, Hadley. 2022. Tidyverse: Easily Install and Load the Tidyverse. https://CRAN.R-project.org/package=tidyverse.
Wickham, Hadley, Mara Averick, Jennifer Bryan, et al. 2019. “Welcome to the Tidyverse.” Journal of Open Source Software 4 (43): 1686. https://joss.theoj.org/papers/10.21105/joss.01686.
|
| You are visitor 01402503 — GeezerVison does not store the pages you look up. Best viewed with Netscape Navigator 4.7 or Internet Explorer 6 at 800×600. No cookies required. |