GV

GeezerVison

The World Wide Web, restored to 800 pixels of glory.

Home|About|Gaming cabinet|Archives|How it works|Starter sites

On this site

  • mapsf
  • Get started
  • Reference
  • Cheat Sheet
  • How to Create Faceted Maps
  • How to Create Inset Maps
  • How to Export Maps
  • How to Use a Custom Font Family
  • How to Use Themes
  • Changelog

This view

  • Original page
  • New address

GeezerVison is showing riatelab.github.io — mapsf: thematic cartography

mapsf

CRAN mapsf status badge code coverage: 95%status downloads

Create thematic maps and integrate them into your R workflow.

This package helps you design different cartographic representations such as proportional symbols, choropleths, or typology maps. It also provides several functions for displaying layout elements that enhance the graphical presentation of maps (e.g., scale bar, north arrow, title, labels). mapsf maps sf objects on base graphics.

Installation

You can install the released version of mapsf from CRAN with:

install.packages("mapsf")

Alternatively, you can install the development version of mapsf (the dev branch) from r-universe with:

install.packages("mapsf", repos = c("https://riatelab.r-universe.dev", "https://cloud.r-project.org"))

Usage

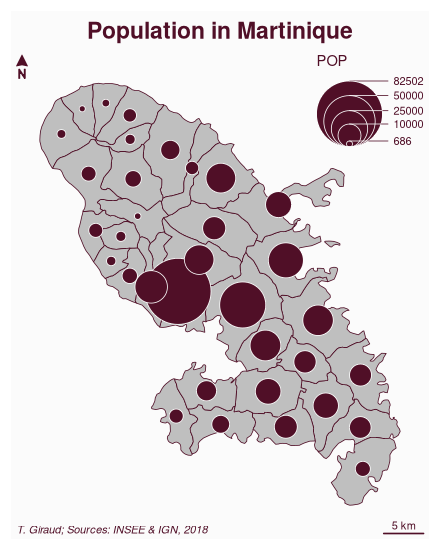
This is a basic example which shows how to create a map with mapsf.

library(mapsf)
# Import the sample dataset
mtq <- mf_get_mtq()
# Plot the base map
mf_map(x = mtq)
# Plot proportional symbols
mf_map(x = mtq, var = "POP", type = "prop", leg_pos = "topright", add = TRUE)
# Plot a map layout
mf_layout(
  title = "Population in Martinique",
  credits = "T. Giraud; Sources: INSEE & IGN, 2018"
)

A simple map created with mapsf

You can find more detailed examples on the “Get Started” section of the package website and you can also download its cheat sheet.
Cheat Sheet

mapsf.gui mapsf.gui logo

The mapsf.gui package provides a Shiny interface for creating thematic maps using mapsf. Users of the application can build thematic maps interactively and automatically generate the corresponding R code to reproduce the map identically.

Alternatives

  • tmap
  • ggplot2 + ggspatial

Community Guidelines

One can contribute to the package through pull requests and report issues or ask questions here. See the CONTRIBUTING.md file for detailed instructions on how to contribute.
This project uses conventional commits and semantic versioning.

You are visitor 01402520 — GeezerVison does not store the pages you look up.
Best viewed with Netscape Navigator 4.7 or Internet Explorer 6 at 800×600. No cookies required.