Note
Go to the end to download the full example code or to run this example in your browser via JupyterLite or Binder.
Comparison of F-test and mutual information#
This example illustrates the differences between univariate F-test statistics and mutual information.
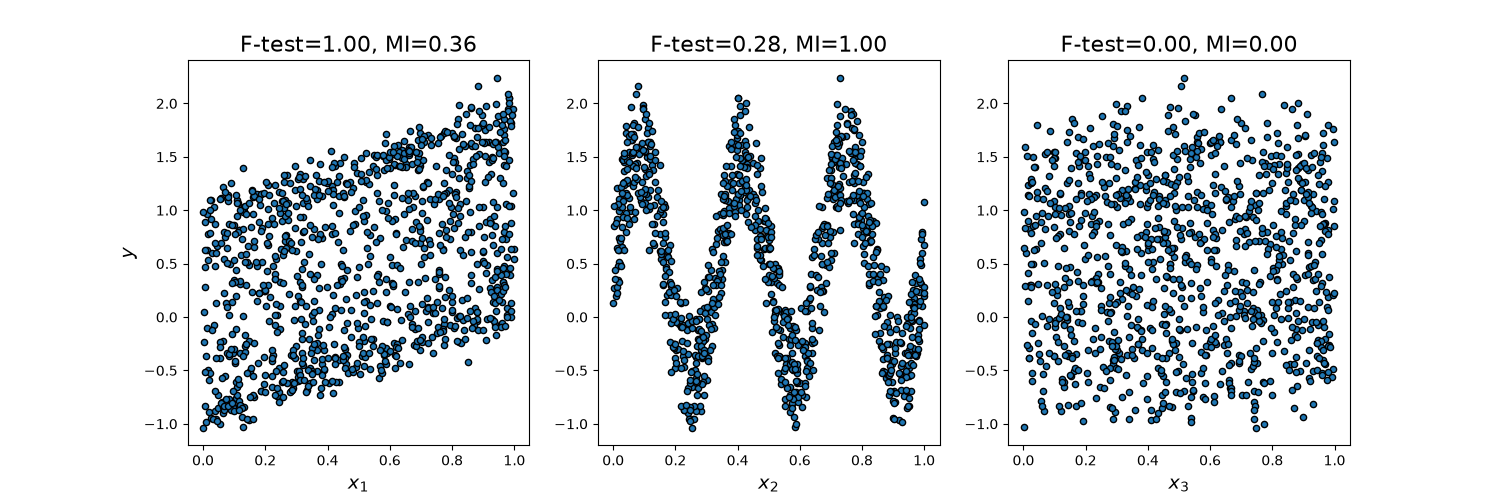
We consider 3 features x_1, x_2, x_3 distributed uniformly over [0, 1], the target depends on them as follows:
y = x_1 + sin(6 * pi * x_2) + 0.1 * N(0, 1), that is the third feature is completely irrelevant.
The code below plots the dependency of y against individual x_i and normalized values of univariate F-tests statistics and mutual information.
As F-test captures only linear dependency, it rates x_1 as the most discriminative feature. On the other hand, mutual information can capture any kind of dependency between variables and it rates x_2 as the most discriminative feature, which probably agrees better with our intuitive perception for this example. Both methods correctly mark x_3 as irrelevant.
# Authors: The scikit-learn developers
# SPDX-License-Identifier: BSD-3-Clause

import matplotlib.pyplot as plt
import numpy as np

from sklearn.feature_selection import f_regression, mutual_info_regression

np.random.seed(0)
X = np.random.rand(1000, 3)
y = X[:, 0] + np.sin(6 * np.pi * X[:, 1]) + 0.1 * np.random.randn(1000)

f_test, _ = f_regression(X, y)
f_test /= np.max(f_test)

mi = mutual_info_regression(X, y)
mi /= np.max(mi)

plt.figure(figsize=(15, 5))
for i in range(3):
    plt.subplot(1, 3, i + 1)
    plt.scatter(X[:, i], y, edgecolor="black", s=20)
    plt.xlabel("$x_{}$".format(i + 1), fontsize=14)
    if i == 0:
        plt.ylabel("$y$", fontsize=14)
    plt.title("F-test={:.2f}, MI={:.2f}".format(f_test[i], mi[i]), fontsize=16)
plt.show()
Total running time of the script: (0 minutes 0.254 seconds)


Related examples

Test with permutations the significance of a classification score

Adjustment for chance in clustering performance evaluation

Comparison between grid search and successive halving