Note
Go to the end to download the full example code or to run this example in your browser via JupyterLite or Binder.
Comparing Nearest Neighbors with and without Neighborhood Components Analysis#
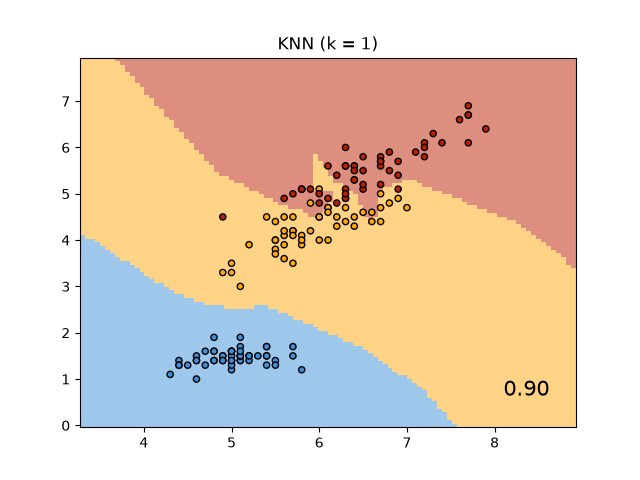
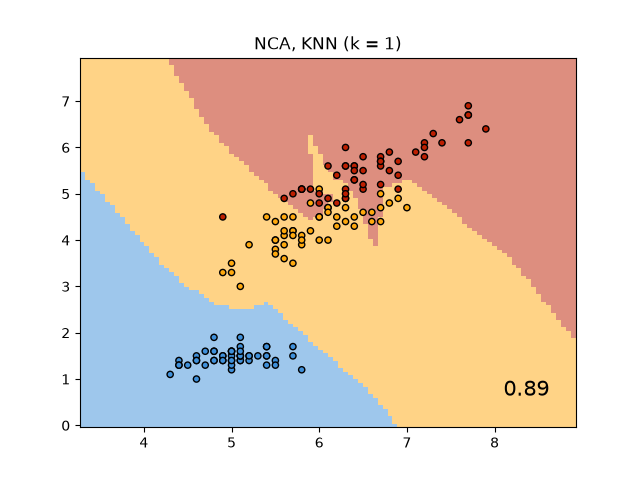
An example comparing nearest neighbors classification with and without Neighborhood Components Analysis.
It will plot the class decision boundaries given by a Nearest Neighbors classifier when using the Euclidean distance on the original features, versus using the Euclidean distance after the transformation learned by Neighborhood Components Analysis. The latter aims to find a linear transformation that maximises the (stochastic) nearest neighbor classification accuracy on the training set.
# Authors: The scikit-learn developers
# SPDX-License-Identifier: BSD-3-Clause

import matplotlib.pyplot as plt
from matplotlib.colors import ListedColormap

from sklearn import datasets
from sklearn.inspection import DecisionBoundaryDisplay
from sklearn.model_selection import train_test_split
from sklearn.neighbors import KNeighborsClassifier, NeighborhoodComponentsAnalysis
from sklearn.pipeline import Pipeline
from sklearn.preprocessing import StandardScaler

n_neighbors = 1

dataset = datasets.load_iris()
X, y = dataset.data, dataset.target

# we only take two features. We could avoid this ugly
# slicing by using a two-dim dataset
X = X[:, [0, 2]]

X_train, X_test, y_train, y_test = train_test_split(
    X, y, stratify=y, test_size=0.7, random_state=42
)


names = ["KNN", "NCA, KNN"]

classifiers = [
    Pipeline(
        [
            ("scaler", StandardScaler()),
            ("knn", KNeighborsClassifier(n_neighbors=n_neighbors)),
        ]
    ),
    Pipeline(
        [
            ("scaler", StandardScaler()),
            ("nca", NeighborhoodComponentsAnalysis()),
            ("knn", KNeighborsClassifier(n_neighbors=n_neighbors)),
        ]
    ),
]

for name, clf in zip(names, classifiers):
    clf.fit(X_train, y_train)
    score = clf.score(X_test, y_test)

    _, ax = plt.subplots()
    disp = DecisionBoundaryDisplay.from_estimator(
        clf,
        X,
        alpha=0.5,
        ax=ax,
        response_method="predict",
        plot_method="pcolormesh",
        shading="auto",
    )

    # Plot also the training and testing points
    cmap = ListedColormap(disp.multiclass_colors_)
    plt.scatter(X[:, 0], X[:, 1], c=y, cmap=cmap, edgecolor="k", s=20)
    plt.title(f"{name} (k = {n_neighbors})")
    plt.text(
        0.9,
        0.1,
        f"{score:.2f}",
        size=15,
        ha="center",
        va="center",
        transform=plt.gca().transAxes,
    )

plt.show()
Total running time of the script: (0 minutes 0.160 seconds)


Related examples
Dimensionality Reduction with Neighborhood Components Analysis
Dimensionality Reduction with Neighborhood Components Analysis